Figures & data
Figure 1. Scheme of the Easycounter YC device.
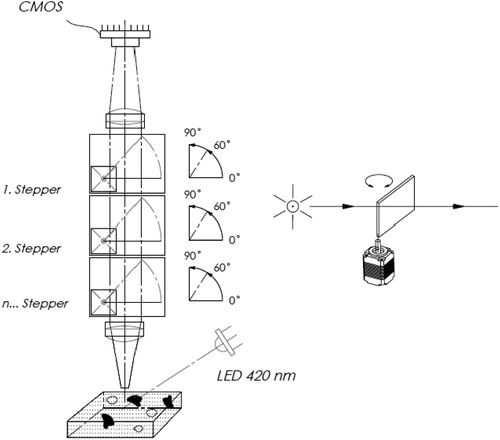
Figure 2. Chemical structure of PO-TEDM-1 dye.
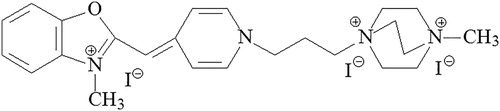
Figure 3. Kinetics of interaction of PO-TEDM-1, YOYO-1 and propidium iodide with DNA at optimal concentration of the components.
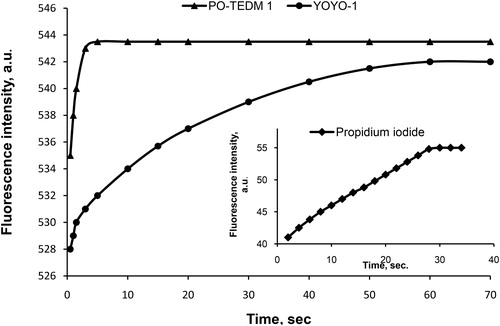
Figure 4. Effect of optimal concentration of fluorescent dye on staining of yeast cells.
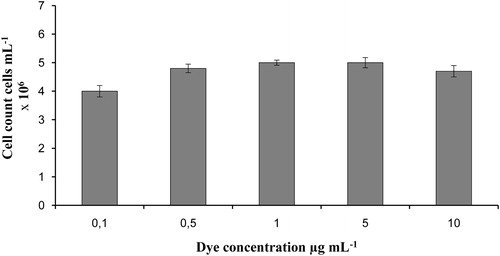
Figure 5. Cell count linearity measured by automated Easycounter YC.
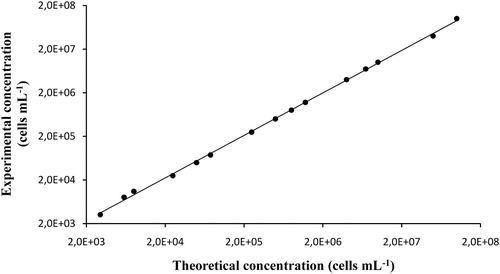
Figure 6. Images of samples with increasing cell concentration (1 × 10⁵, 1 × 10⁶, 1 × 10⁷ cells mL−1) captured using automated Easycounter YC.
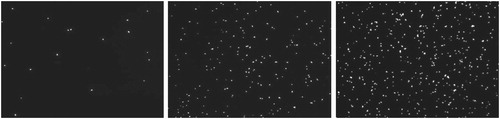
Table 1. Coefficient of variation (CV, %) of measurements of different cell concentrations in the range from 3 × 10³ to 1 × 10⁸ by using automated Easycounter YC and manual hemocytometer.
Figure 7. Viability linearity in cell samples measured by automated Easycounter YC.
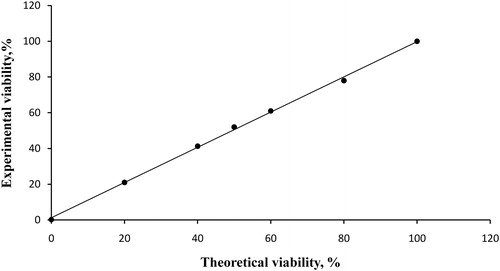
Figure 8. Total cell number and viability as a function of cultivation time. Results were obtained by both Easycounter YC image cytometer and manual hemocytometer.
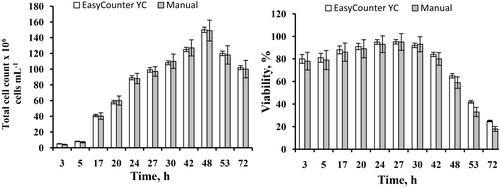
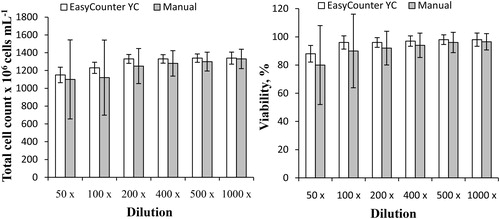
Figure 9. Total cell count and viability of yeast cells from a propagator as a function of dilution, measured by Easycounter YC and manual hemocytometer.