
Figures & data
Figure 1. Exon-intron structure (a), sequence alignment and nine conserved characteristic motifs (I-IX) of PHI-1 proteins (b).
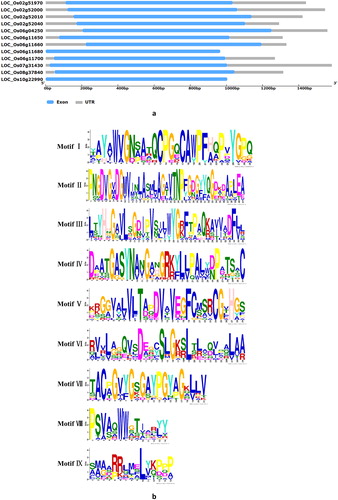
Table 1. Features of the PHI-1 family genes from rice and predicted localization of the PHI-1 proteins.
Figure 2. Chromosomal distribution of OsPHI-1 genes.
Note: Two clusters of tandemly arranged OsPHI-1 genes are indicated in red frames.
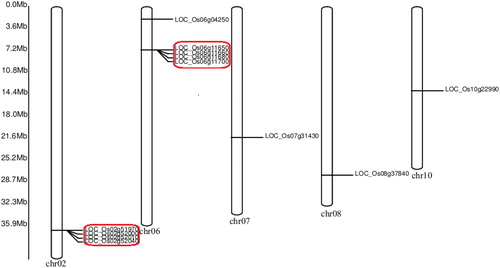
Figure 3. Phylogenetic tree of PHI-1 proteins and their classification in Arabidopsis and rice. Note: The unrooted tree was constructed based on multiple sequence alignment of full-length protein sequences using ClustaW by the neighbour-joining method with 1000 bootstrap replicates. The bar indicates 0.05 substitutions per site. Each coloured box with a number represents a specific motif in the protein identified using the MEME motif search tool.
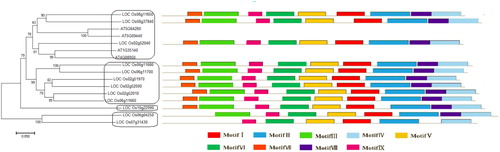
Figure 4. Expression patterns of rice PHI-1 in various tissues and developmental stages. M, mature leaf; Y, young leaf; SAM, shoot apical meristem; P1–P6, stages of panicle development; S1–S5, stages of seed development. Note: Hierarchical clustering analysis of 11 PHI-1 genes represented on Affymetrix Rice Genome Array is shown. Clustering was done based on average log2 signal values for three biological replicates of each sample after normalisation of the raw data. The colour scale for log signal values is shown at the bottom.
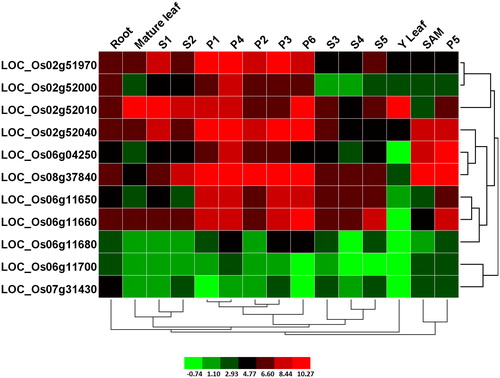
Figure 5. Differential OsPHI-1 expression following hormone treatment. (a) Two-week-old seedlings treated with tZ and DMSO for 30 and 120 min; (b) 7-day-old rice seedlings treated with IAA and BAP. RD, root tissues following treatment with DMSO; Rt, root tissues following treatment with tZ; LD, leaf tissues following treatment with DMSO; Lt, leaf tissues following treatment with tZ; SCK, 7-day-old rice seedlings; S-IAA, 7-day-old rice seedlings treated with indole-3-acetic acid; S-BAP, 7-day-old rice seedlings treated with benzyl aminopurine. Note: Clustering was done based on log2 signal values for three biological replicates of each sample after normalisation of the raw data. The colour scale for log signal values is shown at the bottom.
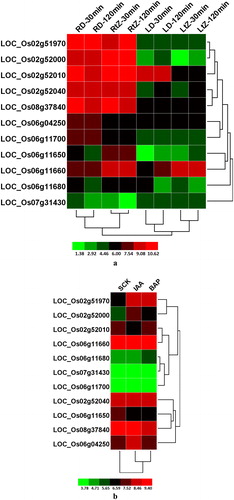
Figure 6. Differential expression of rice PHI-1 genes in response to abiotic stresses. (a) Differential developmental stages under various abiotic conditions; (b) 7-day-old young seedlings under abiotic stresses; (c) the genes up-regulated or down-regulated by more than twofold in any of the three abiotic stresses as compared with CK. 1, seedling stage; 2, booting stage; 3, heading and flowering stage; L, leaf; S, spike; C, cold stress; D, dehydration stress; H, high temperature stress; CK, as compared with an untreated seedling. The colour bar representing log2 signal values is shown at the bottom.
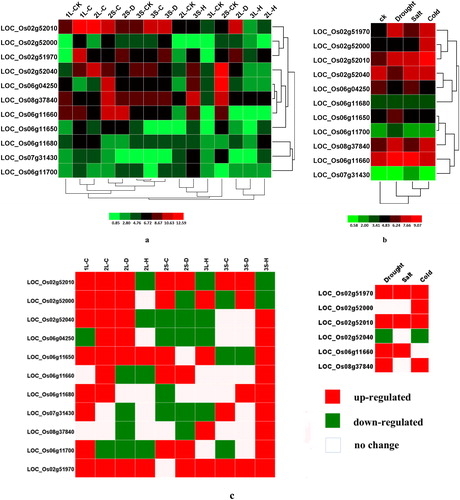
Figure 7. Putative regulatory cis-elements in 5′-upstream regions of the PHI-1 gene promoter in rice. Note: The colour bars represent each cis-element on the Z axis; the gene names are on the X axis; the Y axis represents the abundance of the cis-elements.
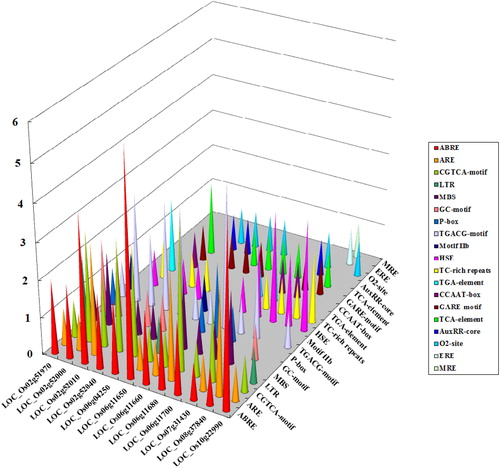
Table 2. Putative regulatory cis-elements in the 5′-upstream regions of PHI-1 genes in rice.