Figures & data
Figure 1. MRI imaging of a patient who underwent total resection and treatment with TMZ before (A) and after (B) the operation.
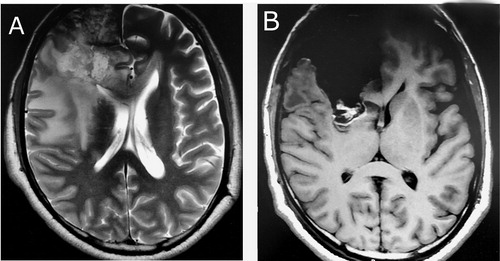
Table 1. Distribution of glioma subtypes in the study group.
Figure 2. MSP amplification of the MGMT promoter CpG region using a methylated (M) and an unmethylated (U) set of primers; lanes 8–27, methylated and bisulphite converted DNA isolated from tumour samples.
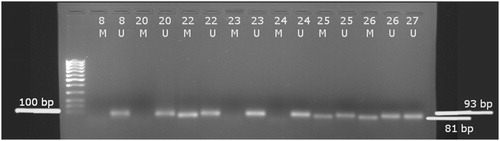
Table 2. Clinical characteristics and survival data.
Table 3. Comparison of survival distributions (log-rank test).
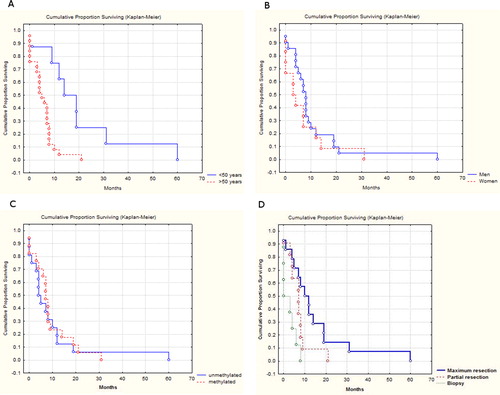
Figure 3. Kaplan–Meier estimates of overall survival (months) related to age (A), gender (B), MGMT promoter methylation status (C) and type of resection (D).