Figures & data
Figure 1. Immunofluorescent analysis of p53 localization in control and HMGB1-treated human adenocarcinoma lung cancer cells A549. (A–E) P53 signal alone is presented in the black-and-white images on the left parts of panels (A–E). The right parts of the panels present two-colour merged images [where p53 signal (green) is superposed with DAPI staining (red)]. (F) Statistical analysis of the fluorescence intensity of the nuclear p53; an outline of the nuclei counterstained with DAPI was used in the green channel and the integrated density in these masks was calculated. Minimum 150 nuclei were scored for each experimental condition in three independent experiments (n = 3). (G) Differences among the groups were determined by ANOVA with Tukey's multiple comparisons test using GraphPad Prism version 7.0. A value of P < 0.05 was considered statistically significant (**P < 0.01; ***P < 0.001; ****P < 0.0001).
![Figure 1. Immunofluorescent analysis of p53 localization in control and HMGB1-treated human adenocarcinoma lung cancer cells A549. (A–E) P53 signal alone is presented in the black-and-white images on the left parts of panels (A–E). The right parts of the panels present two-colour merged images [where p53 signal (green) is superposed with DAPI staining (red)]. (F) Statistical analysis of the fluorescence intensity of the nuclear p53; an outline of the nuclei counterstained with DAPI was used in the green channel and the integrated density in these masks was calculated. Minimum 150 nuclei were scored for each experimental condition in three independent experiments (n = 3). (G) Differences among the groups were determined by ANOVA with Tukey's multiple comparisons test using GraphPad Prism version 7.0. A value of P < 0.05 was considered statistically significant (**P < 0.01; ***P < 0.001; ****P < 0.0001).](/cms/asset/0c675257-d9ca-4a20-accc-07b1a374112e/tbeq_a_1604159_f0001_c.jpg)
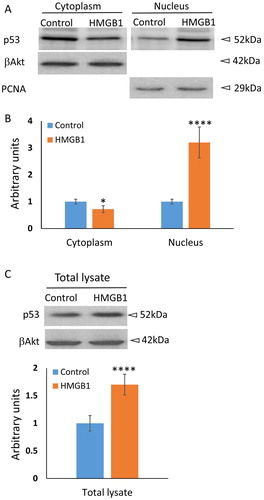
Figure 2. Western blot analysis of p53 level in the cytoplasm, in the nucleus or in a total cell lysate of A549 cells in response to 10 nmol/L HMGB1 for 16 h. (A) In these experiments both the control and the HMGB1 cells incubated with 10 nmol/L were starved for 8 h in low serum (1% FBS) medium prior to the incubation. β-actin was used as a loading control for the cytoplasmic fraction and PCNA for nuclear fraction. (B) Densitometric analysis is summarised in the bar graph as mean values ± SD (n = 3). *P < 0.05 (Student’s t-test). (C) Western blot analysis of total lysates of control and 10 nmol/L HMGB1-treated cells. ****P < 0.0001 (Student’s t-test).