Figures & data
Figure 1. Phylogenetic tree of bZIP family transcription factors from celery and Arabidopsis.
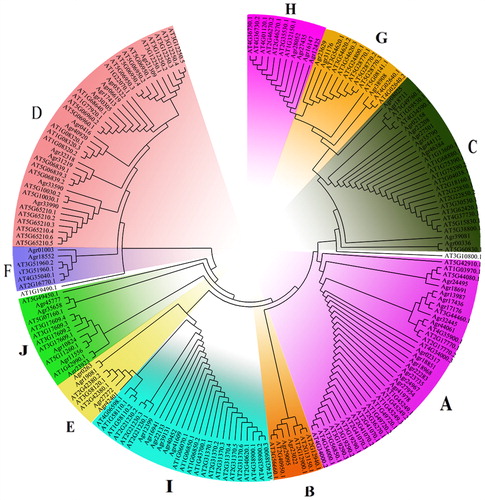
Figure 2. Classification of bZIP family transcription factors in celery and the percentage of every subfamily.
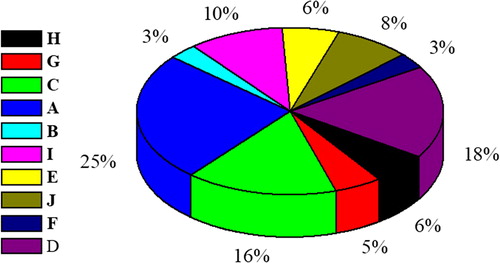
Figure 3. Sequence logos of transcription factors domains in celery.
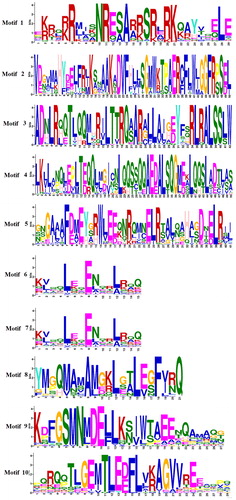
Figure 4. Motifs of bZIP transcription factors from different subfamilies in celery.
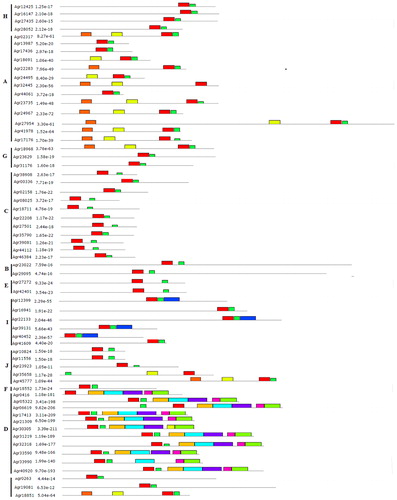
Figure 5. Evolution of bZIP transcription factors family among plants.
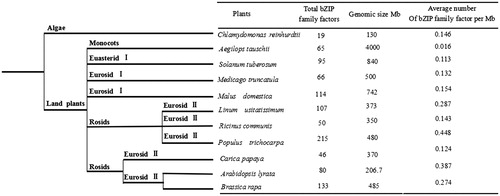
Figure 6. Functional interaction networks of 62 AgbZIP transcription factors.
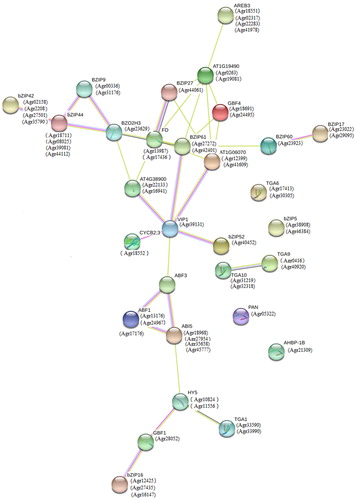
Figure 7. Expression profiling of the 12 bZIP genes of celery under abiotic stress. Abiotic treatments were: high-temperature treatment: 38° C growth chamber; low-temperature: 4° C growth chamber; drought treatment: PEG6000 (200 g·L−1); salt treatment: NaCl (200 mmol·L−1).
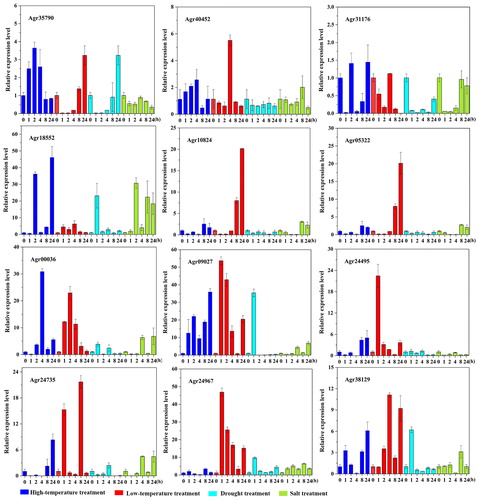
Figure 8. Expression profiling of the 12 bZIP genes of celery roots, petioles and leaf blades.
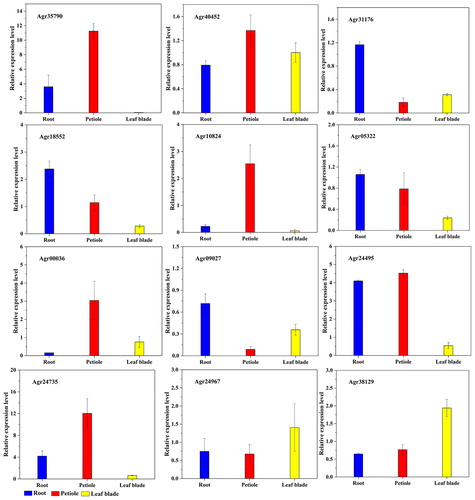
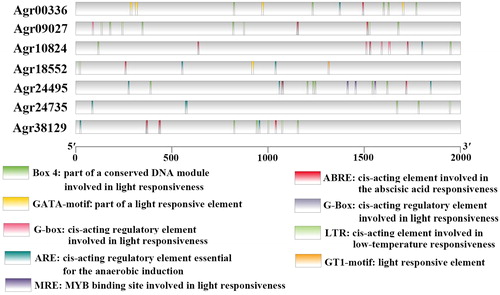
Figure 9. cis elements analysis of the promoter regions of celery bZIP genes. The micro-segments in different colours are the putative elements sequence.