
Figures & data
Table 1. Simplex lattice design and experimental data for responses from Callistemon extract.
Figure 1. Comparison of extraction methods with aqueous and organic solvents for extracts from leaf and flower of C. citrinus. CLWA, HPLC grade water leaf extract; CLMT, methanol leaf extract; CLAC, acetone leaf extract; CLET, ethanol leaf extract; CFWA, HPLC grade water flower extract; CFMT, methanol flower extract; CFAC, acetone flower extract; CFET, ethanol flower extract.
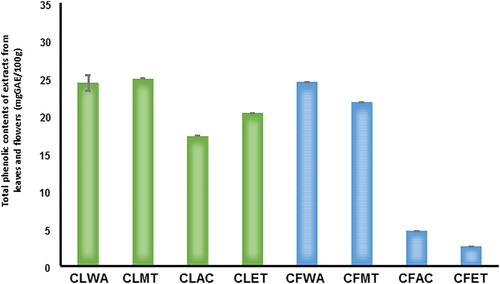
Figure 2. FT-IR spectra of extracts from flowers (a) and leaves (b) of C. citrinus.
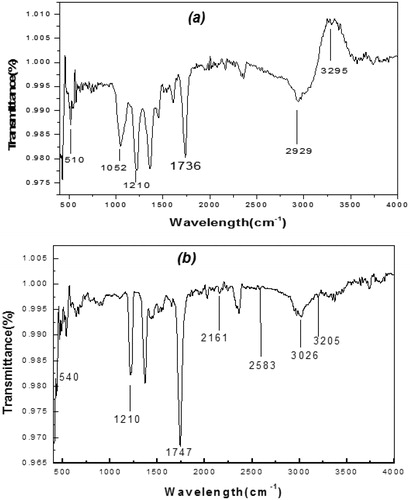
Table 2. Total phenolic contents, antioxidant capacity and α-glucosidase inhibition potential of extracts from Callistemon leaves and flowers.
Table 3. Antibacterial activity of Callistemon extracts against pathogenic gram-positive and gram-negative bacteria.
Table 4. Antibacterial activity of Callistemon extracts against non-pathogenic bacteria.
Figure 3. Population and apoptosis profiles for MCF-7 cell treated with leaf (CL) and flower (CF) extracts.
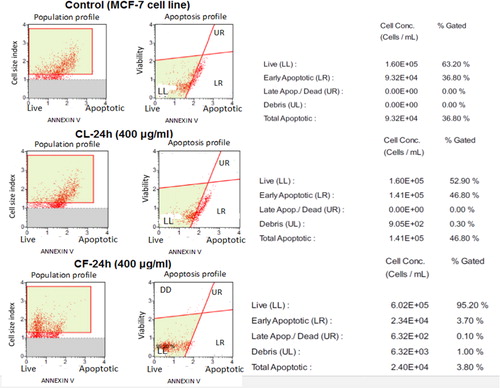
Figure 4. Cell index profiles of fibroblast normal cell line treated with different concentrations of leaf (CL) and flower (CF) extracts from C. citrinus.
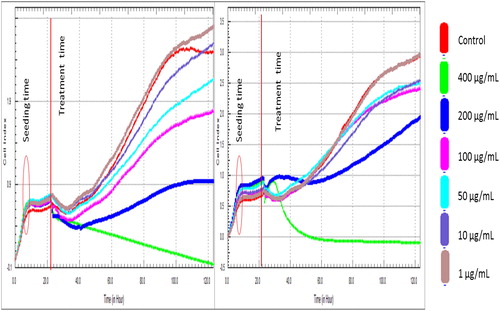
Figure 5. Cell index profiles of MCF-7 cell line treated with different concentrations of leaf (CL) and flower (CF) extracts from C. citrinus.
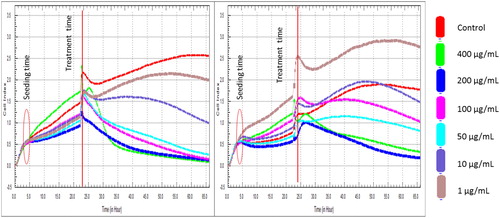
Figure 6. Dose-response curve of MCF-7cell line and IC50 level at 24 h of leaf (CL) and flower (CF) extracts from C. citrinus.
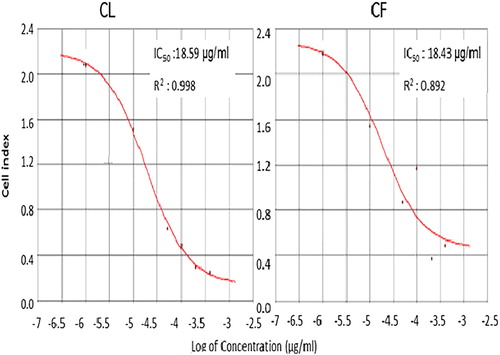
Table 5. MTT cell proliferation rate of MCF-7 cells cultured with and without Callistemon extracts.