Figures & data
Table 1. Distribution of the patients according to the type of DM, the mean age and the duration of DM.
Table 2. Comparative analysis of PVEPs L values between both types of DM at 15° group with newly-diagnosed DM.
Table 3. Comparative analysis of PVEPs A values between both types of DM at 15° group with newly-diagnosed DM.
Figure 1. PVEPs L values in sagittal, IPSI and CROSS electrode positions in DM type 1 and type 2 at 15° group without DR, DM duration >1 year. *Р<0.05, **Р<0.01, ***Р<0.005 and ****Р<0.001.
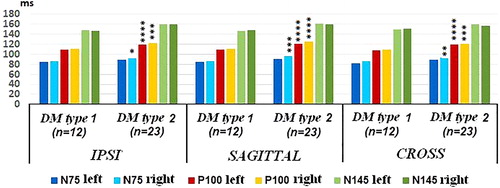
Figure 2. PVEPs A values in sagittal, IPSI and CROSS electrode positions in DM type 1 and type 2 at 15° group without DR, DM duration >1 year. *Р<0.05, **Р<0.01, ***Р<0.005 and **** Р< 0.001.
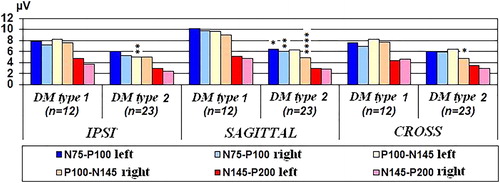
Figure 3. PVEPs L values in sagittal, IPSI and CROSS electrode positions in DM type 1 and type 2 at 15° group with initial DR. *Р < 0.05, **Р < 0.01, ***Р < 0.005 and ****Р < 0.001.
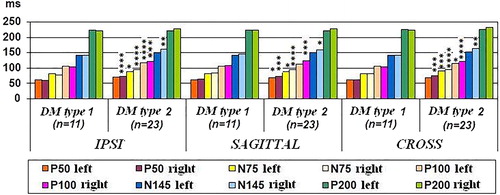
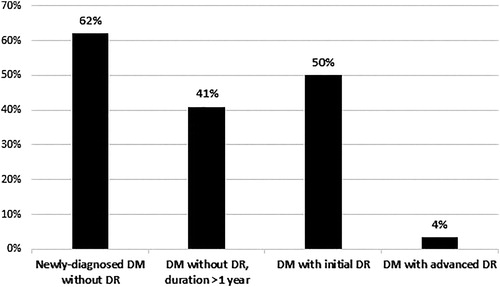
Figure 4. Percentage distribution of the number of different PVEPs values between patients with type 1 and type 2 DM in the different groups.