Figures & data
Figure 1. Samples used in this study. Note: Each hole in A, B, C, D and E was infused with 10 µL of sterile distilled water, while each hole of a, b, c, d and e was infused with 10 µL of a suspension with 1 × 10⁵ spores/mL of Penicillium.
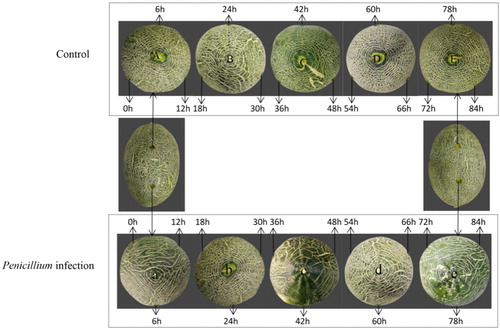
Figure 2. Prediction of conserved domains (CDs) of the HmCDPK1 protein.
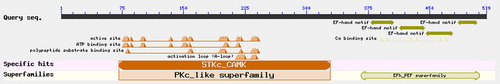
Table 1. Prediction of the physical and chemical properties of HmCDPK1.
Figure 3. Prediction of the secondary structure of the HmCDPK1 protein. Note: Blue, purple, green and red indicate a-helix, irregular coil, β-corner and extended-chain amino acids, respectively.
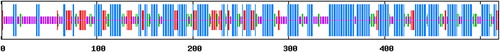
Figure 4. Tertiary structure model of the HmCDPK1 protein.
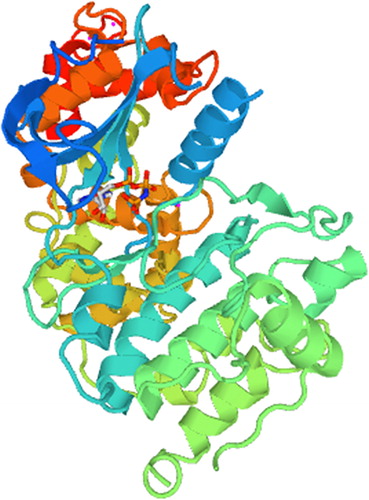
Figure 5. Phylogenetic tree of the amino acids of HmCDPK1 and other plant CDPK.
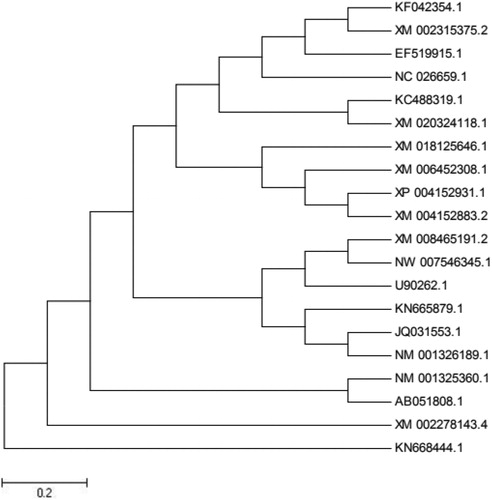
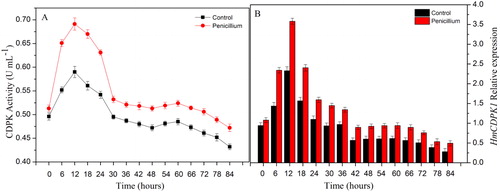
Figure 6. Expression of HmCDPK in response to Penicillium infection at different time points. (A) CDPK activity in Hami melons infected by Penicillium infection and controls. (B) Levels of HmCDPK1 transcript in Hami melons infected by Penicillium infection and controls. Note: Error bars represent the standard deviation of the means.