Figures & data
Table 1. Primers used in real-time qPCR.
Figure 1. Effects of hyperoside on the neurobehavioural score and infarct volume ratio in I/R rats ( ± SD, n = 8). Neurological deficit scores (A); TTC staining (B); infract size (C). **P < 0.01, vs the sham group; #P < 0.05, ##P < 0.01, vs I/R group.
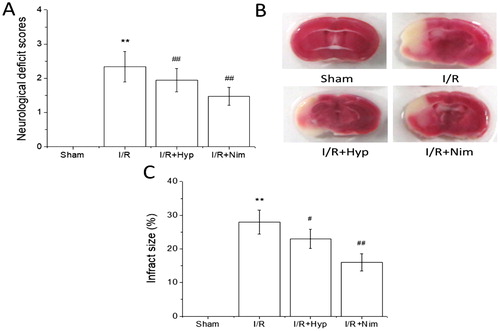
Figure 2. Effects of hyperoside on T-AOC, SOD and GSH-Px activities and MDA content in the brain tissue of I/R rats ( ± SD, n = 8). T-AOC activity (A); SOD activity (B); GSH-Px activity (C); MDA content (D). **P < 0.01, vs the sham group; #P < 0.05, vs I/R group; ##P < 0.01, vs I/R group.
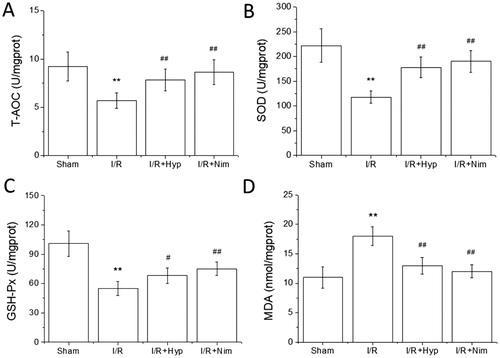
Figure 3. Effect of hyperoside on IL-1 β and TNF-α contents in the brain tissue of I/R rats ( ± SD, n = 8). IL-1β content (A); TNF-α content (B). **P < 0.01, vs the sham group; ##P < 0.01, vs I/R group.
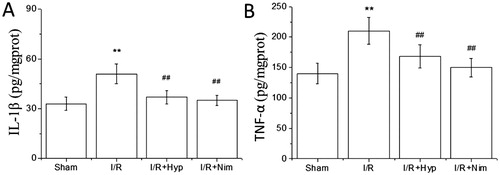
Figure 4. Effects of hyperoside on the expression of Bcl-2, Bax and caspase-3 mRNA in the brain tissue of I/R rats ( ± SD, n = 8). Bcl-2 mRNA level (A); Bax mRNA level (B); caspase-3 mRNA level (C). **P < 0.01, vs the sham group; #P < 0.05, ##P < 0.01, vs I/R group.
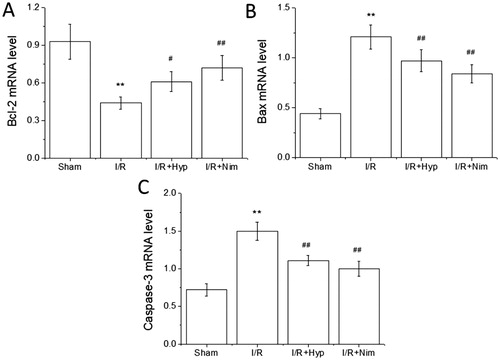
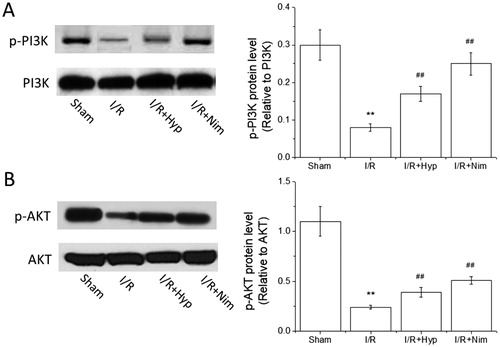
Figure 5. Effects of hyperoside on the expression of p-PI3K and p-AKT proteins in the brain tissue of I/R rats ( ± SD, n = 8). p-PI3K protein level (A); p-AKT protein level (B). **P < 0.01, vs the sham group; ##P < 0.01, vs I/R group.