Figures & data
Table 1. Clinical and pathological data.
Figure 1. Over-expression of CHAF1A in NSCLC tissues and lung cancer cell lines. (A) Immunohistochemical staining of NSCLC tissues (scale bar: 100 μm). (B) H-score analysis of CHAF1A in NSCLC tissues. Compared with the normal control group, *P < 0.05, **P < 0.05, and ***P < 0.05.
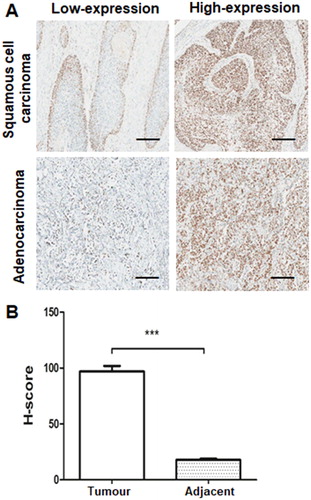
Figure 2. Over-expression of CHAF1A correlates with poor prognosis of NSCLC. Kaplan–Meier curves for the high-expression (A) and low-expression (B) groups.
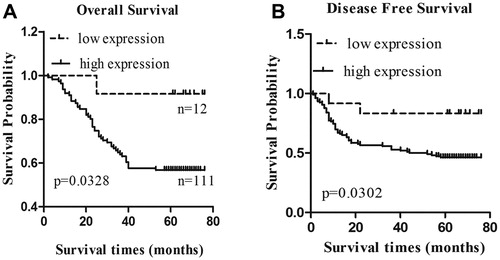
Table 2. Log-rank test of disease-free survival and total survival of NSCLC patients.
Table 3. COX regression analysis.
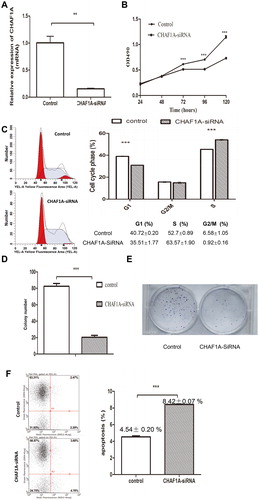
Figure 3. CHAF1A knock-down inhibits proliferation of lung cancer cells. (A) Knock-down efficiency detected by quantitative real-time PCR analysis. Compared with the control group, ** P < 0.01. (B) Cell proliferation assessed at 1–5 days in H1299 cells transfected with CHAF1A-siRNA lentivirus. (C) H1299 cell counts at G1, S and G2/M cell cycle phases detected by flow cytometry at day 5 after CHAF1A-siRNA transfection. (D) Cell clone counts at days 1–3 after CHAF1A-siRNA transfection. (E) Cell colony formation. (F) Apoptotic rate. Compared with the control group, *** P < 0.001.