
Figures & data
Figure 1. Effects of different surfactants on A. pullulans cell growth and PMLA production. Note: Data represent mean values with standard deviation (±SD) from three replicates. If error bars are not visible, they are smaller than the symbol.
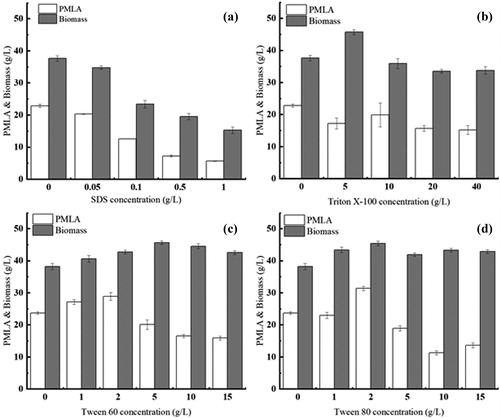
Figure 2. Effects of Tween 80 on PMLA accumulation and cell growth during PMLA batch fermentation of A. pullulans in 5 L quadruple parallel fermentor: (a) PMLA concentration, (b) residual sugar concentration, (c) biomass, (d) PMLA productivity and (e) yield (the ratio of PMLA to cell biomass concentration). Note: Data represent mean values with standard deviation (±SD) from three replicates. If error bars are not visible, they are smaller than the symbol.
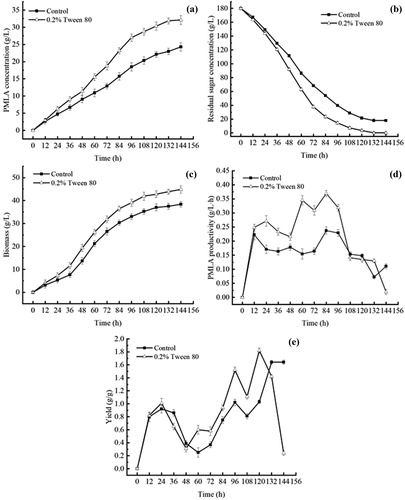
Table 1. Fatty acid composition of A. pullulans cells cultured with and without 2.0% Tween 80 for 120 h.
Table 2. Effect of Tween 80 on cell membrane permeability of A. pullulans as assessed by flow cytometry.
Figure 3. Transmission electron microscopy results: (a) control, (b) marked section of (a), (c) 0.2% Tween 80, (d) marked section of (c).
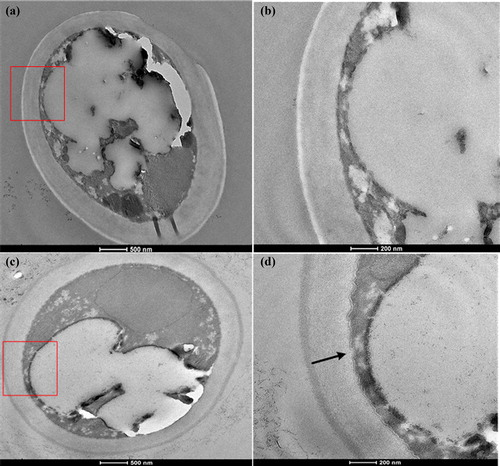
Figure 4. Effects of adding Tween 80 on the metabolic pathway of A. pullulans. PMLA: Poly(β-L-malic acid); FMN: Flavin mononucleotide; FeS: iron-sulfur clusters; CoQ: Coenzyme Q; Cyt c: Cytochrome c.
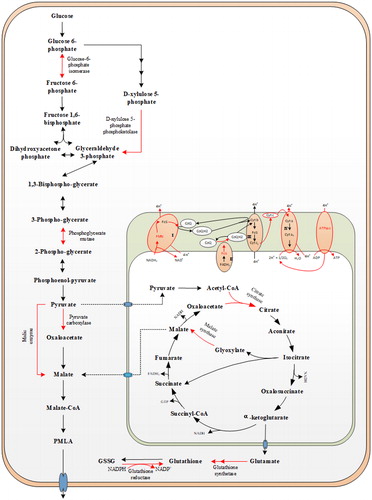
Table 3. Changes in protein expression after addition of Tween 80.