Figures & data
Figure 1. Curve of B. amyloliquefaciens LZN01 growth (A) and the effects of the CFS on Fon mycelial growth (B). 12 h, 24 h, 36 h, 48 h, 60 h and 72 h: the CFS from B. amyloliquefaciens LZN01 in relation to the incubation time.
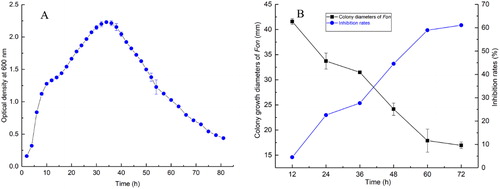
Figure 2. SEM and TEM micrographs of Fon conidia treated with the CFS from B. amyloliquefaciens LZN01: (A) 50% CFS from LB medium at 72 h (SEM), (B) 50% CFS from B. amyloliquefaciens LZN01 at 72 h (SEM), (C) 75% CFS from LB medium at 72 h (SEM), (D) 75% CFS from B. amyloliquefaciens LZN01 at 72 h (SEM), (E) 50% CFS from LB medium at 72 h (TEM), (F) 50% CFS from B. amyloliquefaciens LZN01 at 72 h (TEM), (G) 75% CFS from LB medium at 72 h (TEM), (H) 75% CFS from B. amyloliquefaciens LZN01 at 72 h (TEM).
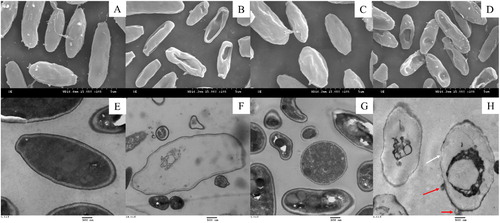
Figure 3. Confocal laser scanning micrographs of Fon conidia and mycelia treated with the CFS from B. amyloliquefaciens LZN01 and LB medium: CFS from B. amyloliquefaciens LZN01 for 12 h (A), 24 h (B), 36 h (C) and 48 h (D) vs. CFS from LB medium for 12 h (E), 24 h (F), 36 h (G) and 48 h (H).
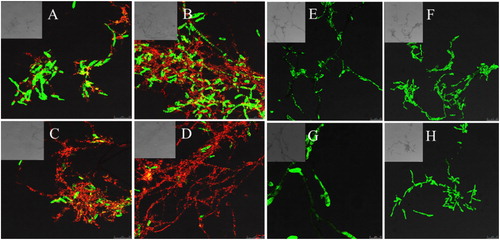
Figure 4. Principle component analysis (A) and (orthogonal) partial least squares discriminant analysis (B, C and D) score plots of the datasets obtained by the LC-MS and UHPLC-LTQ Orbitrap MS analysis of B. amyloliquefaciens LZN01 and its growth medium. The quality of the (O)PLS-DA models was evaluated by R2X, R2Y, Q2Y and p values and validated by 200 permutation tests.
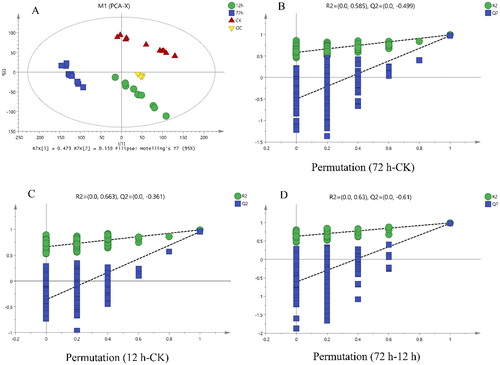
Figure 5. Major differential metabolites among experimental groups.
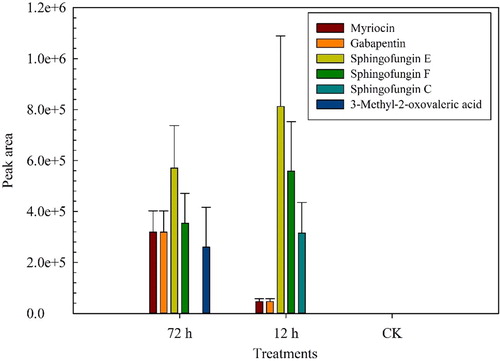
Figure 6. Effects of myriocin (A), 3-methyl-2-oxovaleric acid (B) and gabapentin (C) on the mycelial growth of Fon.
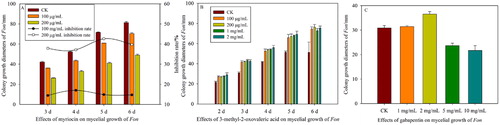
Figure 7. Quantitative analysis of myriocin in the CFS from LB medium at 72 h (A), CFS from B. amyloliquefaciens LZN01 at 12 h (B) and CFS from B. amyloliquefaciens LZN01 at 72 h (C).
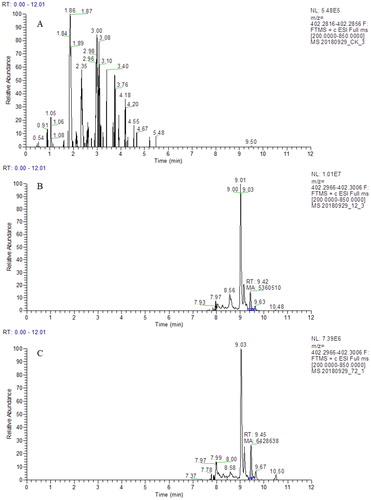
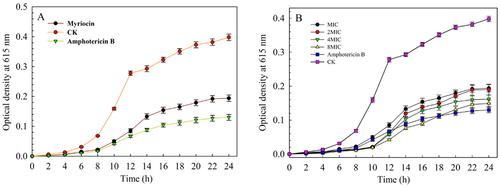
Figure 8. The minimal inhibitory concentrations of myriocin against Fon (A) and time-kill curves of myriocin with different concentrations against Fon for 24 h (B). Data are expressed as the means ± SD (n = 3).