
Figures & data
Table 1. Location and sample size of the four populations in the study.
Table 2. Ten primer combinations used for genetic analysis of the four H. caudigerum Baill populations.
Table 3. Analysis of molecular variance for four high altitude populations of H. caudigerum Baill based on AFLP and cpDNA sequence data.
Table 4. Mantel test relationship between geographic (above diagonal) and genetic distance (below diagonal).
Figure 1. UPGMA dendrogram of 70 accessions using AFLP.
Note: Samples from 2800 m (up-pointing triangles); samples from 3000 m (down-pointing triangles); samples from 3100 m (filled circles); samples from 3300 m (open circles).
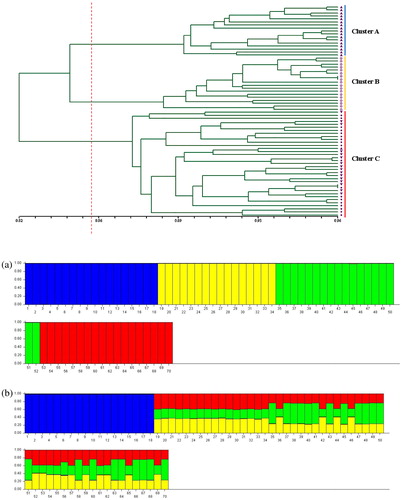
Figure 2. Individual-based cluster analysis using STRUCTURE for K = 4 based on AFLP data (a) and cpDNA data (b).
Note: samples from 2800 m (blue); samples from 3000 m (yellow); samples from 3100 m (green); samples from 3300 m (red).
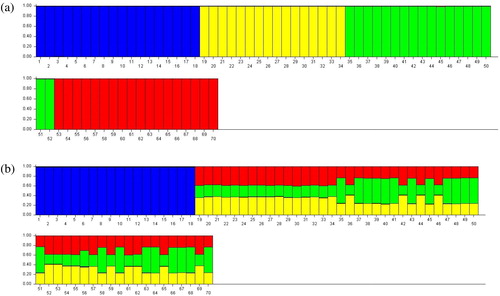
Table 5. Genetic diversity information of cpDNA sequences in H. caudigerum Baill populations from different altitudes.
Table 6. Haplotype distribution based on cpDNA sequences in different altitude populations of H. caudigerum Baill.
Table 7. Fst value pairwise difference of populations of H. caudigerum Baill.
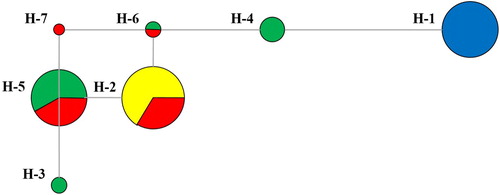
Figure 3. cpDNA haplotype network based on cpDNA data.
Note: samples from 2800 m (blue); samples from 3000 m (yellow); samples from 3100 m (green); samples from 3300 m (red).
Supplemental Material
Download PDF (331.6 KB)Data archiving statement
There are no linked research data sets for this submission. The following reason is given: All data generated or analyzed during this study are included in this published article and its Additional files.