
Figures & data
Figure 1. Number of differentially expressed lncRNAs identified from each comparison.
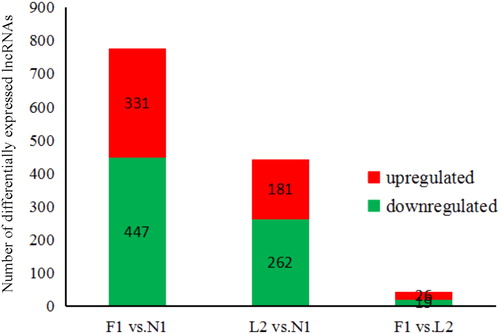
Table 1. Overlapped lncRNAs among F1 vs. N1, F1 vs. L2, and L2 vs. N1.
Figure 2. Validation of lncRNAs expression profiles by qPCR. The expression pattern of five lncRNA were tested between F1 and N1 group (a); between L2 and N1 group (b) and between F1 and L2 group (c).
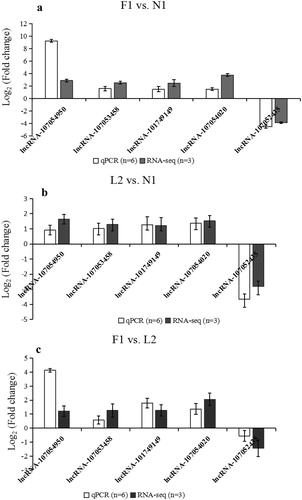
Table 2. Overlapped lncRNAs that target mRNAs among F1 vs. N1, F1 vs. L2, and N1 vs. L2.
Table 3. Interconnectivity among miRNAs, lncRNAs and mRNAs identified in F1 vs. N1 and L2 vs. N1.
Table 4. Functional enrichment of altered lncRNA highly related to skin and feather development between F1 and N1 group.
Table 5. Functional enrichment of altered lncRNA highly related to skin and feather development between L2 and N1 group.
Figure 3. Network construction of lncRNA-mRNA-miRNA interaction possibly related to skin and feather development identified between groups. Red nodes represent down-regulated genes (F1 or L2 group compared to the N1), and green nodes represent up-regulated genes (F1 or L2 group compared to the N1). Large nodes indicate bigger degrees. The diamond-shaped nodes represent lncRNAs, the round rectangle-shaped nodes represent microRNAs. The Ellipse-shaped nodes represent genes. The number of edges between two nodes represents the number of their enrichment GO terms involved in skin and feather development.
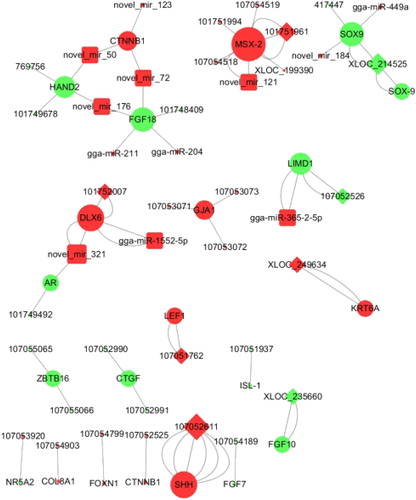
Table 6. lncRNA-mRNA pairs possibly related to skin and feather development identified between F1 and N1 groups.
Table 7. lncRNA-mRNA pairs possibly related to skin and feather development identified between L2 and N1 groups.
Table 8. miRNA-mRNA pairs correlated to lncRNA possibly related to skin and feather development identified between F1 and N1 groups.
Table 9. miRNA-mRNA pairs correlated to lncRNA possibly related to skin and feather development identified between L2 and N1 groups.
Supplemental Material
Download PDF (949.2 KB)Availability of data and materials
The raw sequencing data in this study is deposited into the Sequence Read Archive Repository (https://www.ncbi.nlm.nih.gov/bioproject/) with accession number PRJNA376472. The N1 group included N11, N12 and N13 individuals; the L1 group included L21, L22 and L23 individuals; and the F1 group included F11, F12 and F13 individuals.