Figures & data
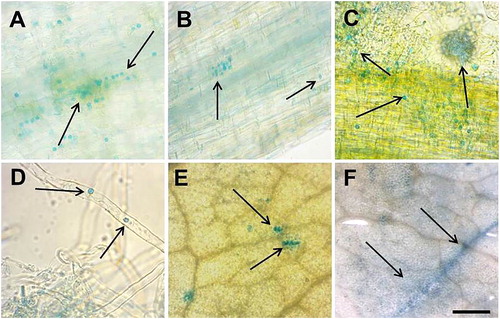
Figure 1. Histochemical GUS signal localization in М. truncatula pGRAS::GUS-GFP transcriptional reporter plants before and after Rhizobium inoculation. Signal detection in vascular system of the secondary root branches and leaf petiole (A), elongation zone of main root and lateral roots (B), elongation and meristematic zone of the root tip and vascular system of the root (C and D), infection thread and small vesicles (E), lateral root primordial and in meristematic zone of root nodules (F). Scale bar = 50 µm.
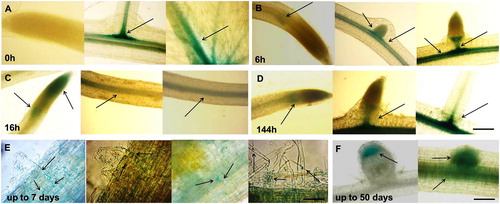
Figure 2. Histochemical GUS signal localization in mature М. truncatula pGRAS::GUS-GFP transcriptional reporter plants grown in hydroponic containers. Signal detection in the vascular system of leaves and in petiole (A, B and C), root tip and secondary root primordium (D), root colummela (E), vascular system of the roots (F), root nodules (G), nodules vasculature (H), meristematic zone of the induced nodules (I and J). Scale bar = 0.50 to 3 cm.
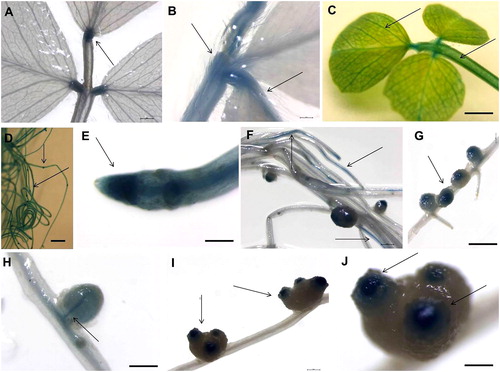
Figure 3. Histochemical GUS signal localization in М. truncatula pGRAS::GUS-GFP transcriptional reporter plants before and after salinity stress. Signal detection in control plants (A), plants exposed to 50 mmol L−1 NaCl (B) or 100 mmol L−1 NaCl (C). Scale bar = 0.50 to 3 cm.
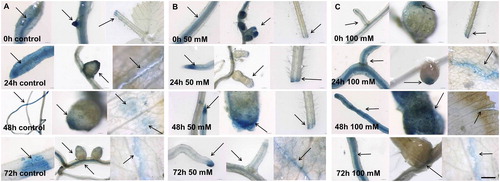
Figure 4. Light microscopy for histochemical GUS signal localization in М. truncatula pGRAS::GUS-GFP transcriptional reporter plants after salinity stress with 50 mmol L−1 NaCl. Signal detection in root epidermal cells (A and B), root hairs (C and D), leaf epidermal cells (E and F). Scale bar = 0.50 to 3 cm.