
Figures & data
Table 1. Clinical data of dry eye patients.
Figure 1. Effect of combination treatment on the tear breakup time, Schirmer I test, and fluorescein staining of non-SID patients. Thirty-three patients (66 eyes) were included. *P < 0.05 compared with Day 0; ***P < 0.001 compared with Day 0.
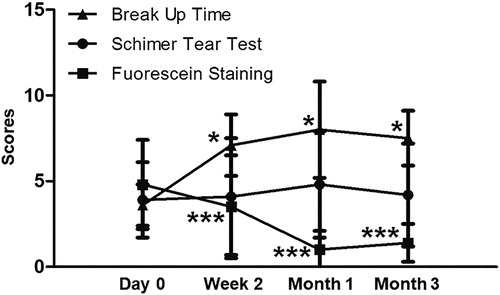
Figure 2. Effect of combination treatment on meibum score, meiboscore and R-scan in non-SID patients. Thirty-three patients (66 eyes) were included. *P < 0.05 compared with Day 0; ***P < 0.001 compared with Day 0.
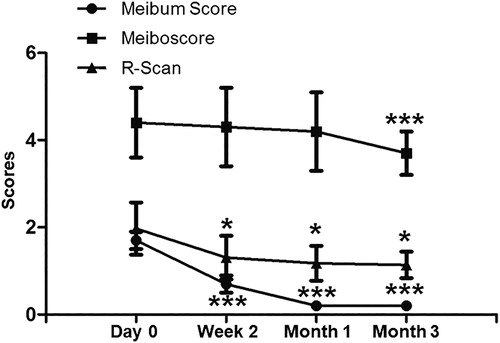
Figure 3. Ocular surface parameters in SID patients. Fifteen patients (30 eyes) were included. *P < 0.05 compared with Day 0; **P < 0.01 compared with Day 0; ***P < 0.001 compared with Day 0.
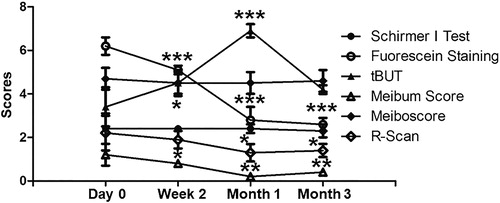
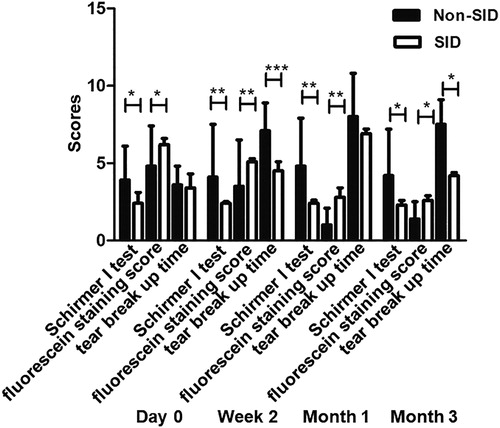
Figure 4. Comparison of Schirmer I test results, fluorescein staining scores and tear break up time (tBUT) between SID patients and non-SID patients. *P < 0.05; **P < 0.01; ***P < 0.001.
Availability of data and materials
The datasets used and/or analyzed in the present study are available from the corresponding author upon reasonable request.