
Figures & data
Table 1. Primer sequences used in real-time PCR.
Figure 1. LC3 puncta analysis in pORF5-HeLa cells and vector-HeLa cells. (A) Signals of LC3 protein in pORF5-HeLa cells and vector-HeLa cells treated either with or without serum starvation for 24 h under a fluorescence microscope (1000×). (B) Quantification of LC3 puncta from a total of 500 cells per treatment from three independent experiments. Note: (A) Red signals represented LC3, and nucleus was stained with DAPI (blue); (B) *p < .01 and #p > .05.
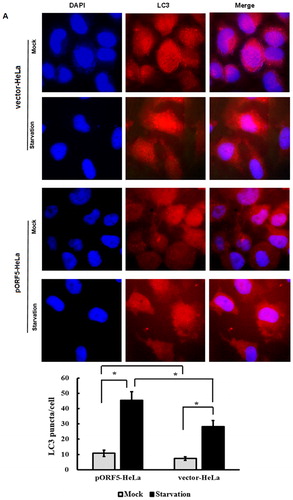
Figure 2. Effect of pORF5 protein on autophagy under conditions of nutrient deprivation. (A) Protein expression of LC3-I, LC3-II and Beclin-1 in pORF5-HeLa cells and vector-HeLa cells treated under different conditions (serum starvation and non-serum starvation) detected by Western blotting. (B) Effect of pORF5 on protein expression of LC3 and Beclin-1. (C) Bar graph representing the LC3-II/LC3-I ratio. (D) Bar graph representing Beclin-1 expression. (E) Effect of BafA on the ratio of LC3-II/LC3-I. (F) LC3-II accumulation elevation induced by pORF5 in the presence of BafA. Note: Relative protein abundance of each band was normalized to the grey value of β-actin, and the bands were quantified by densitometry expressed as means ± standard deviation. These data represent three independent experiments. *p < .01, **p < .05 and #p > .05.
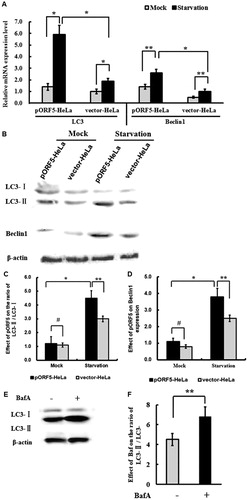
Figure 3. Inhibitory effect of pORF5 protein on HeLa cells apoptosis induced by TNF-α. (A) Hoechst staining of pORF5-HeLa cells and vector-HeLa cells treated with TNF-α for 6 h. (B) TUNEL staining of pORF5-HeLa cells and vector-HeLa cells treated with TNF-α for 6 h under a fluorescence microscope (200×). (C) Quantification of apoptosis rate performed by counting apoptotic cells from five randomly selected fields, and a significant increase in pORF5-HeLa cells when compared to vector-HeLa cells. (D) Percentage of apoptotic cells detected by flow cytometry in pORF5-HeLa and vector-HeLa. Note: All data are expressed as means ± standard deviation calculated from at least three independent experiments. These data represent three independent experiments. *p < .01.
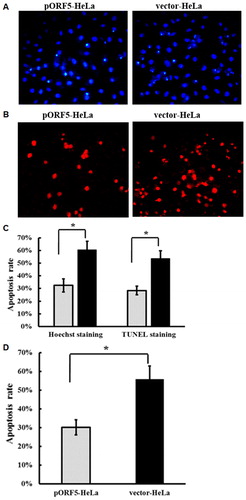
Figure 4. Inhibition of caspase-3 activation and regulation of of Bcl-2 and Bax expression caused by pORF5. (A) Western blotting for detection of the expression of cleaved Caspase-3, Bax and Bcl-2 proteins in pORF5-HeLa cells and vector-HeLa cells treated with TNF-α for 6 h. (B) Quantification of p17 Caspase-3 subunit. (C) mRNA expression of Caspase-3, Bcl-2 and Bax measured by real-time PCR. (D) Up-regulation of Bcl-2 expression and down-regulation of Bax expression caused by pORF5 (data representing three independent experiments). Note: Bar graphs represent the expression of p17 Caspase-3 subunit from three independent experiments. *p < .01, **p < .05 and #p > .05.
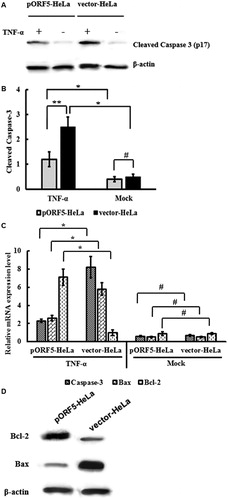
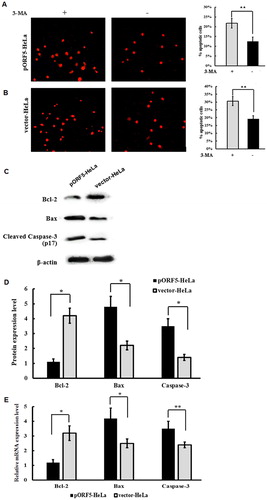
Figure 5. Crosstalk between autophagy and apoptosis in HeLa cells mediated by pORF5either with or without autophagy inhibitor 3-MA under starvation condition. (A) TUNEL staining of pORF5-HeLa cells and vector-HeLa cells under a fluorescence microscope (200×). (B) Percentage of TUNEL-positive cells out of the total number of cells in pORF5-HeLa and vector-HeLa cells. (C) Expression of cleaved Caspase-3, Bax and Bcl-2 determined by Western blotting. (D) Quantification of protein bands by laser densitometry after normalization with respect to β-actin. (E) mRNA expression of Caspase-3, Bax and Bcl-2 measured with real-time PCR (data representing three independent experiments). *p < .01 and **p < .05.
Availability of data and materials
The datasets used and/or analyzed during the current study are available from the corresponding author on reasonable request.