Figures & data
Table 1. PCR primers used for amplification of selected T2D related gene fragments harboring targeted SNPs.
Table 2. Description of SBE primers used for the detection of seven SNPs related to type II diabetes mellitus along with the allele frequencies regardless of the disease.
Figure 1. Electrophoregram displaying PCR products (1–7) on 2% agarose gel. M, 100-bp DNA ladder (Promega Inc., Madison, WI, USA). Lanes 1–7 refer to genes GNB-3, GCK, SLC30A, KNJ11, TCF7L2, CDKN2A/B and HNF4A, respectively.
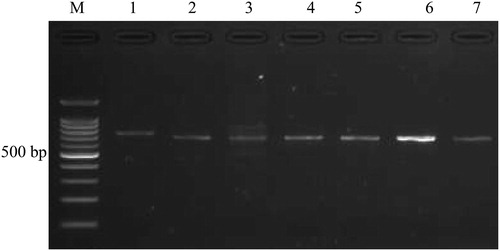
Table 3. Results from SNaPshot genotyping for T2D patients and controls.
Figure 2. GeneMapper electrophoregram of representative SNaPshot fragment analysis of seven SNPs for a given T2D patient. Bins are labeled at the exact place where each allele should migrate. The X and Y axes represent size (nucleotides) and rfu (relative fluorescence units), respectively. The selected subject was genotyped (from left to right) for the genes GNB-3, GCK, SLC30A, KNJ11, TCF7L2, CDKN2A/B and HNF4A, respectively. The genotype of this patient is GA/GA/CC/TT/GT/AA/CT referring to SNPs of the seven genes, respectively.
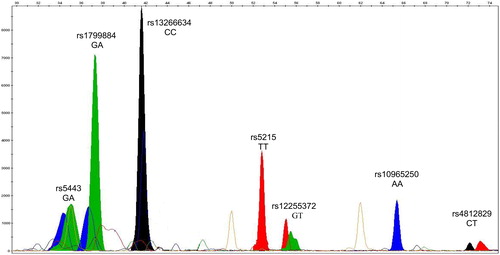
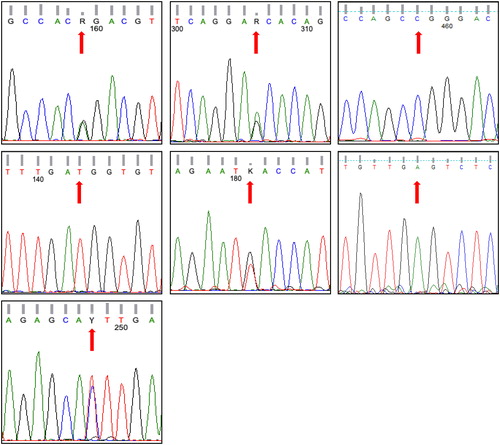
Figure 3. Electrophoregrams generated via Sanger sequencing to confirm SNaPshot fragment analysis of seven SNPs of a subject whose genotype based on capillary electrophoresis is GG/GG/CT/TT/GT/GA/TT referring to SNPs rs5443, rs1799884, rs13266634, rs5215, rs12255372, rs10965250 and rs4812829, respectively. These SNPs refer to genes GNB-3, GCK, SLC30A, KNJ11, TCF7L2, CDKN2A/B and HNF4A, respectively. Note that the pattern of CDKN2A/B gene is for the reverse order of the gene sequence.