Figures & data
Table 1. WBC counts at indicated time points in the experimental groups.
Table 2. CRP levels at indicated time points in the experimental groups.
Table 3. Peripheral blood Cr levels at indicated time points in the experimental groups.
Table 4. Peripheral blood BUN levels at indicated time points in the experimental groups.
Figure 1. Histochemical staining of renal tissues. H&E staining was performed to detect the morphology of the renal tissues in the Control (A), Sham (B), Sepsis (C), PAG (D), and NaHS (E) groups, respectively (magnification ×200). Bar = 50 μm.
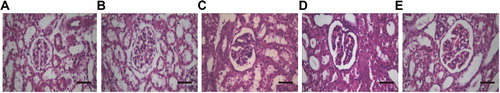
Figure 2. Expression levels of iNOS in renal tissues. The mRNA (A) and protein (B) expression levels of iNOS were detected with SqRT-PCR and Western blot analysis, respectively. Compared with the Control group, *P < 0.05; compared with the Sepsis group, #P < 0.05.
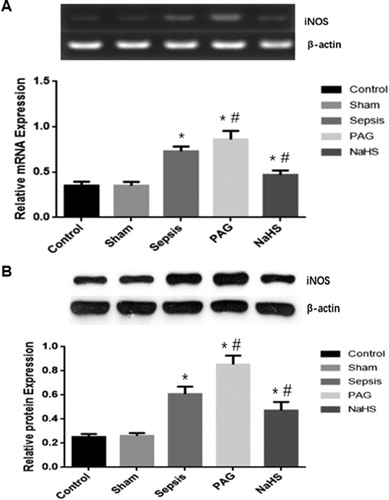
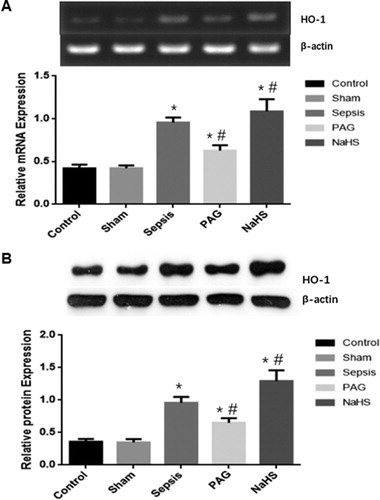
Figure 3. Expression levels of HO-1 in renal tissues. The mRNA (A) and protein (B) expression levels of HO-1 were detected with SqRT-PCR and Western blot analysis, respectively. Compared with the Control group, *P < 0.05; compared with the Sepsis group, #P < 0.05.