Figures & data
Table 1. Primers used in this research.
Figure 1. Fruiting bodies stage of A. heimuer, including primordia (a), ear buds (b), immature period (c), and maturity period (d).
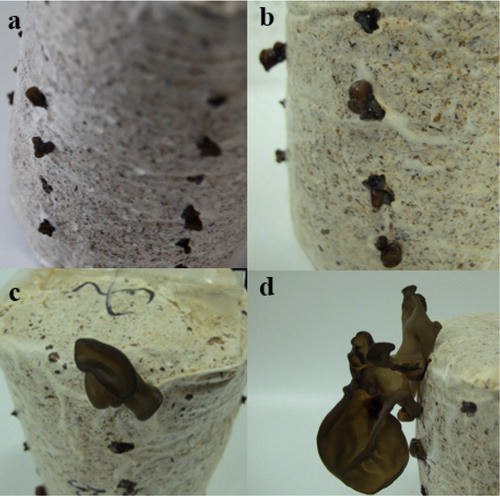
Figure 2. Nucleotide sequence of A-cbh and deduced amino-acid sequence of A-cbh from A. heimuer.
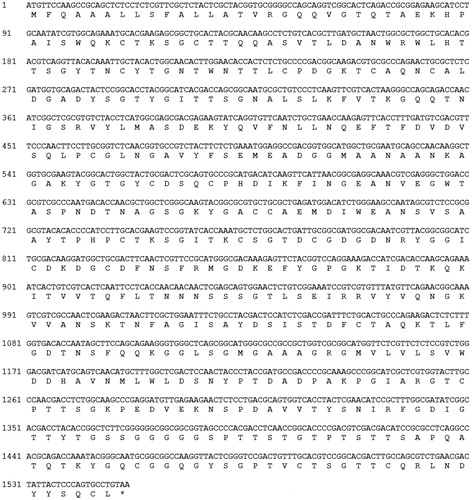
Figure 3. Amino acid composition of A-cbh.
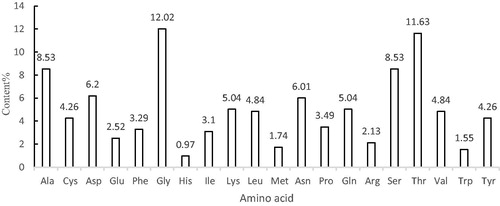
Figure 4. Putative conserved domains of the A-cbh protease (NCBI Conserved Domains search result).
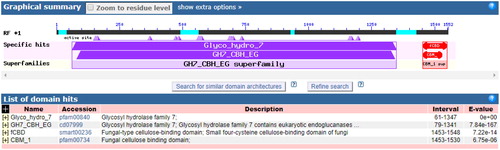
Figure 5. Transmembrane regions prediction of the A-cbh protein.
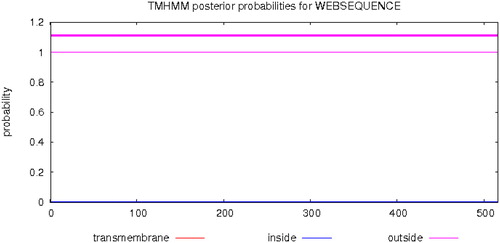
Figure 6. Tertiary structure prediction of the A-cbh protein.
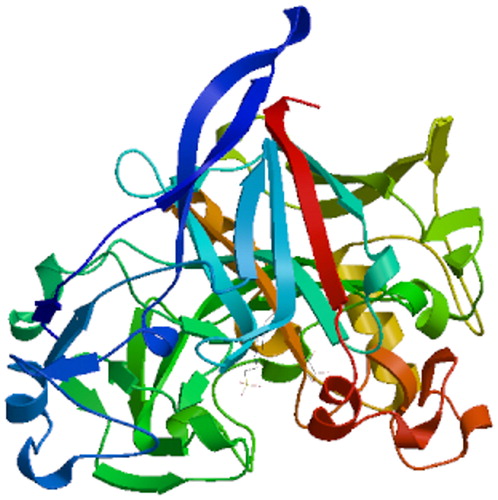
Figure 7. Phylogenetic analysis of A-cbh of A. heimuer.
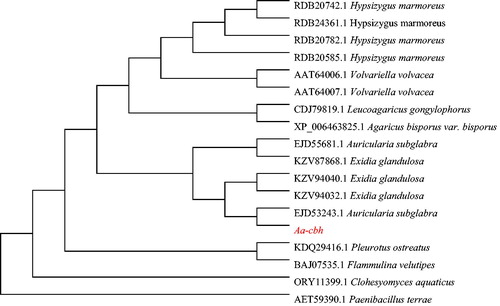
Table 2. Homologous sequences of A-cbh protein.
Figure 8. Heterologous protein expression in E. coli after IPTG (1 mmol/L) induction. M: protein molecular weight marker (Tiangen, Beijing, China); Lane 1: E. coli transformed with the empty vector; Lane 2: E. coli transformed with pET32a-A-cbh induced with IPTG at 0 h; Lane 3: E. coli transformed with pET32a-A-cbh induced with IPTG at 2 h; Lane 4: E. coli transformed with pET32a-A-cbh induced with IPTG at 4 h; Lane 5: E. coli transformed with pET32a-A-cbh induced with IPTG at 6 h; Lane 6: E. coli transformed with pET32a-A-cbh induced with IPTG at 8 h; Lane 7: E. coli transformed with pET32a-A-cbh induced with IPTG at 10 h.
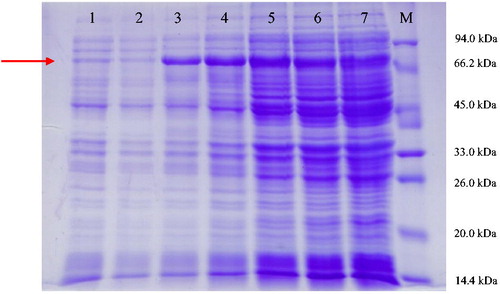
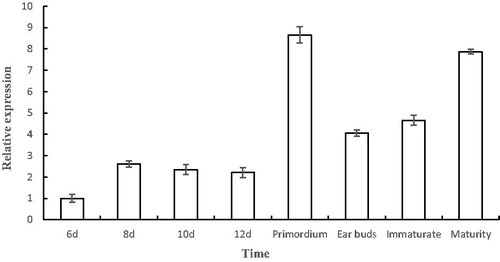
Figure 9. Transcription levels of A-cbh at different stages of A. heimuer.