Figures & data
Figure 1. Schematic representation of DNA structures for GbWRKY1, AtWRKY3, GhWRKY3 and VvWRKY2. White boxes, coding regions; black boxes, introns; grey bars, untranslated regions. Initiation codons (ATG) are indicated by ▼; R-type introns, by ▽; and terminal codons, by ※.
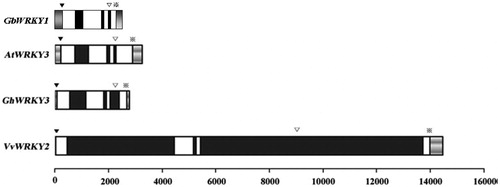
Table 1. Putative cis-acting elements occurring in the promoter of GbWRKY1.
Figure 2. Silencing of GbWRKY1 in cotton by TRV-mediated VIGS. (A) Seedlings of G. barbadense ‘Pima90-53’, hand-infiltrated with Agrobacterium carrying VIGS-vector control – TRV:00 (left) or TRV:GbCLA1 (right). (B) Disease symptoms induced in empty-vector control (TRV:00) or GbWRKY1-silenced (TRV:GbWRKY1) cotton plants after inoculation with V. dahliae strain T5 10 days post-inoculation and RT-PCR analysis of GbWRKY1 after infiltration. (C and D) Ratings for diseased plants and DI values for control (TRV:00) and GbWRKY1-silenced (TRV:GbWRKY1) cotton plants, respectively, after inoculation with conidial suspensions. Error bar represents standard deviation of 3 biological replicates (n ≥ 16).
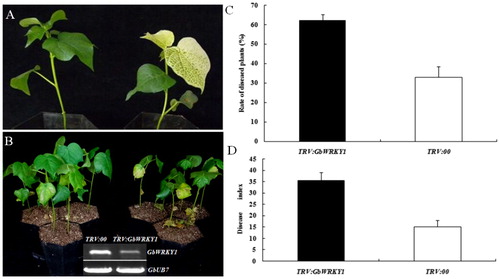
Figure 3. Detection of genes related to signalling pathways for SA (A), JA (B) and ET (C) in TRV:00 and TRV:GbWRKY1 plants. Note. Error bar represents standard deviation for 3 independent experiments; three technical replicates were used in qRT-PCR analysis.
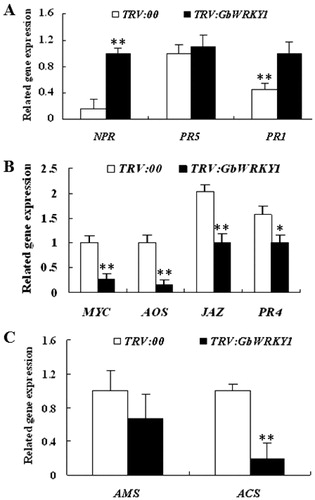
Figure 4. Molecular analysis of GbWRKY1-transformed Arabidopsis and non-transformed plants. (A) Schematic representation of recombinant plasmid PCamE35S-GbWRKY1-hptII. R and L indicate right and left borders of T-DNA. (B) PCR-screening of GbWRKY1. PCR product (495 bp) was amplified from transgenic plants and plasmid (P), but not from WT. M, DNA marker DL2000. (C) Southern blot analysis of GbWRKY1 in transgenic lines and WT. Genomic DNA (20 μg) was digested with HindIII and hybridized against DIG-labeled GbWRKY1 probe. M, DNA Molecular Weight Marker II (Roche). Transgenic lines L1, L2, L4 and L5 of T3 progeny were initially tested. (D) RT-PCR analysis of GbWRKY1 expression in transgenic Arabidopsis lines L1, L2 and L4.
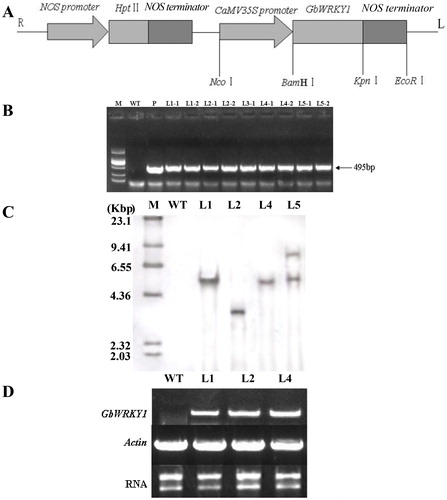
Figure 5. Determination of resistance by transgenic Arabidopsis to V. dahliae. (A) Transgenic lines and non-transformed plants showed obvious differences 2 weeks after inoculation with mock control (H2O only) or spore suspensions (1.9 × 10⁷ conidia mL−1). (B and C) Ratings for diseased plants and DI values for WT Arabidopsis and transgenic Arabidopsis.
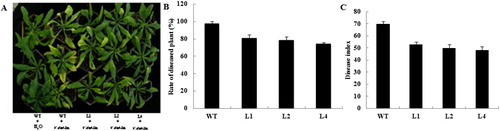
Table 2. Level of resistance by Arabidopsis wild-type ‘Col’ and GbWRKY1-transgenic lines to Verticillium dahliae.
Figure 6. Expression of defence-related PR4 (A), PR5 (B) and ET biosynthesis-related ACS2 (C) after infection with V. dahliae. Total RNA was isolated at indicated time points from transgenic Arabidopsis and WT plants. EF1a was used as internal standard for purposes of normalization.
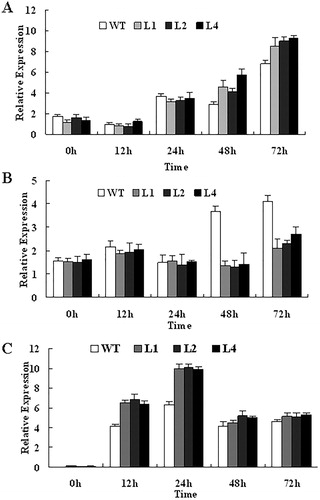
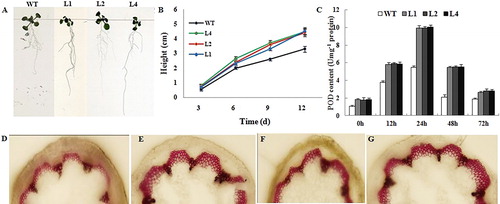
Figure 7. Phenotypes of root growth, POD content and staining of lignin for transgenic and WT Arabidopsis. (A) Phenotypes of root growth for transgenic and WT Arabidopsis on Day 9. (B) Heights of transgenic and WT Arabidopsis plants during first 12 d of growth. (C) POD content of WT and transgenic Arabidopsis plants after infection with V. dahliae. (D, E, F and G) Staining of lignin in WT (D), L1 (E), L2 (F) and L4 (G) transgenic Arabidopsis’s stem after inoculation with V. dahliae (15 days).