
Figures & data
Table 1. Nucleotide sequences of oligonucleotide primers used for RT-PCR to detect CatMV.
Figure 1. Typical symptoms of natural infection of periwinkle with CatMV (A): mosaic leaf deformation and plant stunting; compared to healthy periwinkle leaves (B).
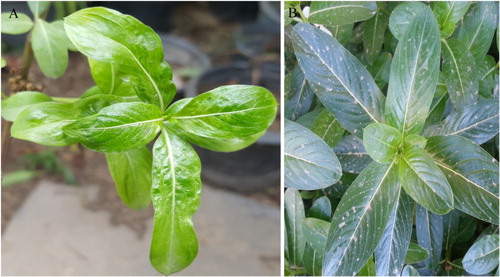
Figure 2. PCR amplifications from CatMV-infected periwinkle in 1.2% agarose gel. Lanes: M, DNA ladder marker; L1, L2, CatMV-infected periwinkle seedlings; L3, L4, healthy periwinkle.
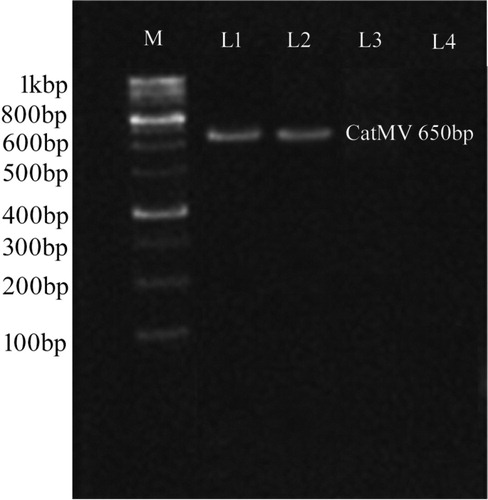
Table 2. Effects of PGPR strains B1, B2 and B1 + B2 on ELISA values, disease severity percentage, and percentage of infections caused by CatMV in periwinkle seedlings under greenhouse conditions.
Figure 3. Effects of PGPR strain treatments on total phenol content (a), alkaloid content (b) and flavonoid content (c) of periwinkle seedlings infected with CatMV under greenhouse conditions.
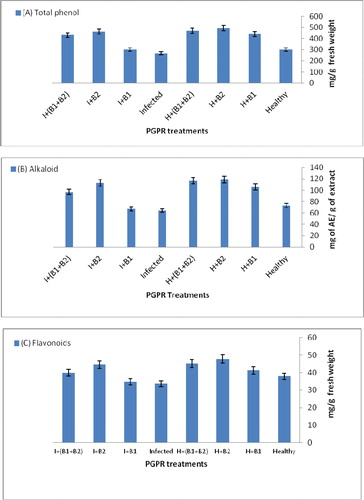
Table 3. Quantitative determination of alkaloidal fractions (vinblastine and vincristine-rich fraction) of C. roseus inoculated by CatMV and treated with PGPR strains (B1, B2 and B1 + B2).