
Figures & data
Figure 1. Location of four investigated populations.
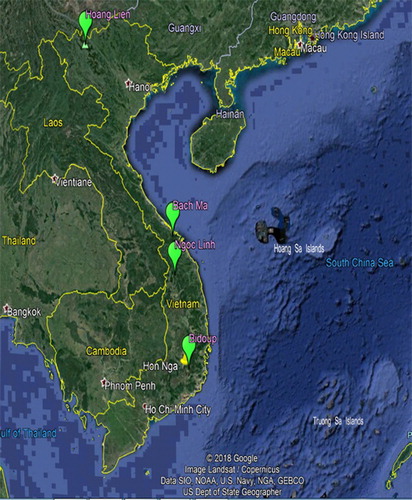
Table 1. Primers used in the study for DNA fingerprinting.
Table 2. Genetic diversity of H. serrata species at population and species level.
Table 3. AMOVA analysis of 80 individuals of four populations of H. serrata using ISSR, SCoT makers and a combination of these markers.
Figure 2. Genetic variation within and among investigated populations based on both ISSR and SCoT techniques.
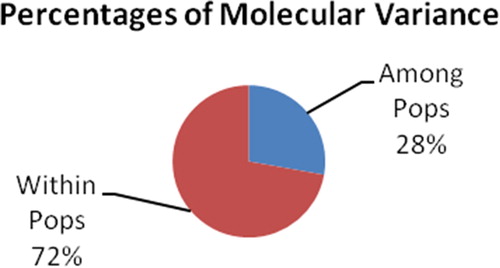
Figure 3. Dendrograms representing the genetic relationship among four investigated populations based on ISSR markers (a), SCoT markers (b) and combined data from these markers (c).
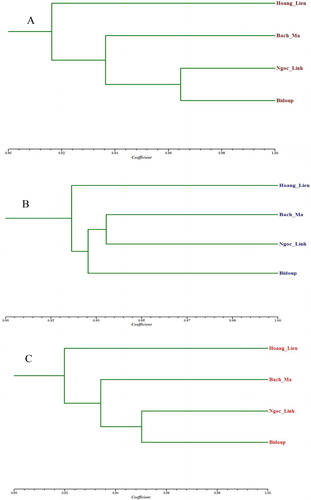
Table 4. Genetic distance among investigated populations based on ISSR, SCoT markers and combined data.