Figures & data
Figure 1. MMP1 expression levels in the nucleus pulposus tissues of IDD.
Note: The mRNA (A) and protein (B) expression levels of MMP1 in the nucleus pulposus tissues of IDD patients and normal control subjects were detected with quantitative real-time PCR and Western blot analysis, respectively. Compared with the control group, *p < 0.05, **p < 0.01.
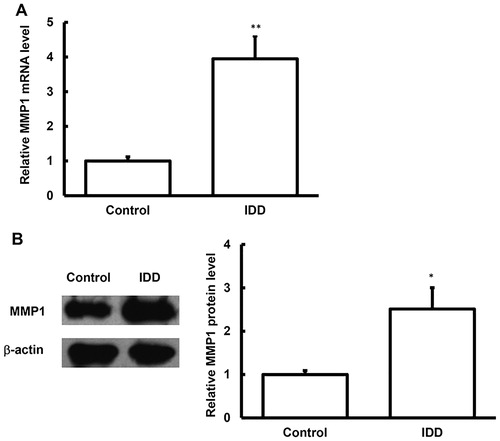
Figure 2. MMP1 expression levels in the blood samples of IDD.
Note: The mRNA (A) and protein (B) expression levels of MMP1 in the blood samples of IDD patients and normal control subjects were detected with quantitative real-time PCR and ELISA, respectively. Compared with the control group, *p < 0.05, **p < 0.01.
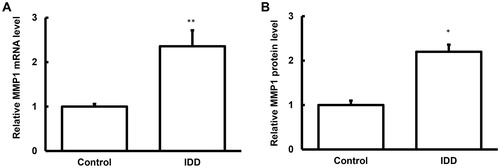
Figure 3. Expression levels of miRNA-222 in the nucleus pulposus tissues and blood samples of IDD.
Note: The expression levels of miRNA-222 in the nucleus pulposus tissues (A) and blood samples (B) of IDD patients and normal control subjects were detected with quantitative real-time PCR. Compared with the control group, *p < 0.05, **p < 0.01.
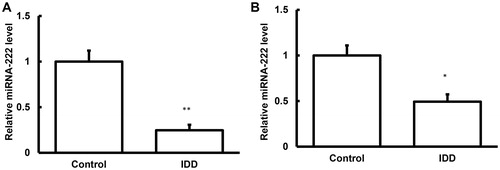
Figure 4. Bioinformatics analysis of the relationship between MMP1 and miRNA-222.
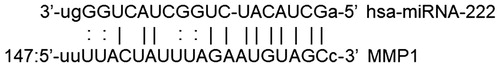
Figure 5. Dual-luciferase reporter assay.
Note: Relative luciferase intensities were shown for the NC, wild-type, and mutant groups. Compared with the negative control (NC) group, *p < 0.05, **p < 0.01.
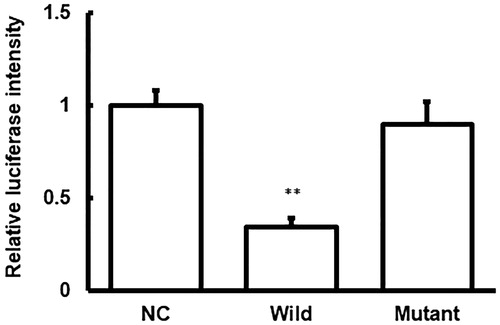
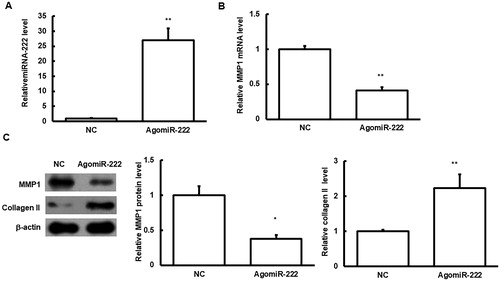
Figure 6. Effects of agomiRNA-222 transfection on HNPC cells.
Note: HNPC cells were transfected with agomiRNA-222. (A) The expression levels of miRNA-222 were detected. (B) The mRNA expression levels of MMP1 in these cells were detected with quantitative real-time PCR. (C) The protein expression levels of MMP1 and type II collagen in these cells were detected with Western blot analysis. Compared with the NC group, *p < 0.05, **p < 0.01.