Figures & data
Figure 1. (A) Synergistic effect of survivin knockdown and E4orf4 overexpression in suppressing cell growth. The absorbance at 450 nm in each group was measured 24 h, 48 h, 72 h and 96 h after transfection. Untreated cells (blank control), cells treated with lipo2000 and cells transfected with the plasmid expressing EGFP (pEGFP) were set as the negative controls. (B) The impact of recombinant vectors on the expression of survivin by RT-qPCR at 36 h after transfection. Expression of survivin mRNA in HeLa cells was determined by using GAPDH as a reference. (C) Inhibition of survivin expression by E4orf4, miR-34a and miR-34a/E4orf4 were analyzed and compared by western blotting at 48 h after transfection. Blank group and lipo2000 group were used as negative controls. GAPDH was used as a reference. (D) Cell apoptosis rate was analyzed by flow cytometric analysis at 48 h after transfection. Annexin V FITC and PI-FL displays the fluorescence intensity of FITC-annexin V and PI, respectively. n = 3, *p < 0.05 versus blank group, lipo2000 group and pEGFP group. #p < 0.05 versus pEGFP-E4orf4 group and pEGFP-miR-34a group.
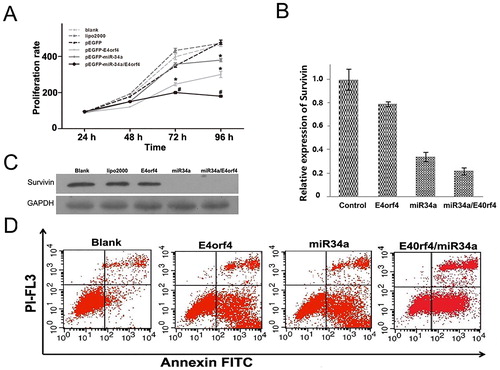
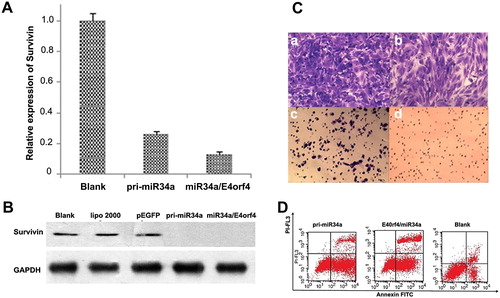
Figure 2. (A) Downregulation of survivin mRNA by miR-34a/E4orf4 and pri-miRNA-34a in Hela cells 36 h after transfection. The expression of survivin mRNA in HeLa cells was determined by RT-qPCR analysis, with GAPDH as a reference. (B) Inhibition of survivin expression by pri-miRNA-34a and miR34/E4orf4 were analyzed and compared by western blotting at 48 h after transfection. Blank group, lipo2000 group and pEGFP group were used as negative controls. (C) Evaluation of invasion of Hela cells induced by pEGFP (b), pri-miR-34a (c), survivin-miRNA (d) and the untreated cells were set as the control (a). (D) Analysis of apoptosis induced by pri-miR-34a and miR-34a/E40rf4 by flow cytometry. n = 3, *p < 0.05.