Figures & data
Figure 1. Structures of the studied flavoalkaloids (2–3), flavonoids from A. monspessulanus ssp. monspessulanus (6–13) and A. monspessulanus ssp. illyricus (4–5). Silybin was used as a reference compound.
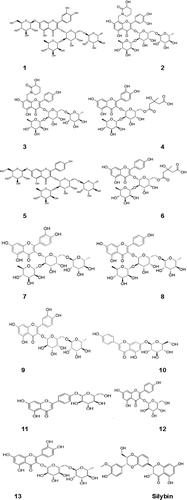
Table 1. Effects of compounds 1–13 and Silybin (S) (at concentrations 1, 10 and 100 µmol/L) administered alone on isolated rat hepatocytes.
Table 2. Hepatotoxic activitiesTable Footnote* and relevant descriptors of the studied compounds.
Figure 2. Effects of compounds 1–13 (at concentration 100 µmol/L), on LDH leakage, in t-BuOOH-induced oxidative stress (at concentration 75 µmol/L) in isolated rat hepatocytes. Each symbol indicates the mean ± SEM of six experiments. Statistically significant differences: ***p < 0.001 vs. control (non-treated hepatocytes); ++p < 0.01; +++p < 0.001 vs. t-BuOOH.
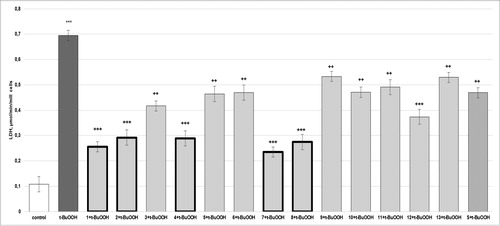
Figure 3. Effects of compounds 1–13 (at concentration 100 µmol/L), on GSH level, in t-BuOOH-induced oxidative stress (at concentration 75 µmol/L) in isolated rat hepatocytes. Each symbol indicates the mean ± SEM of six experiments. Statistically significant differences: ***p < 0.001 vs. control (non-treated hepatocytes); ++p < 0.01; +++p < 0.001 vs. t-BuOOH.
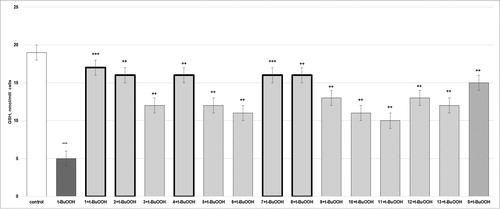
Figure 4. Effects of compounds 1–13 (at concentration 100 µmol/L), on MDA production, in t-BuOOH-induced oxidative stress (at concentration 75 µmol/L) in isolated rat hepatocytes. Each symbol indicates the mean ± SEM of six experiments. Statistically significant differences: ***p < 0.001 vs. control (non-treated hepatocytes); +p < 0.05; ++ p < 0.01; +++ p < 0.001 vs. t-BuOOH.
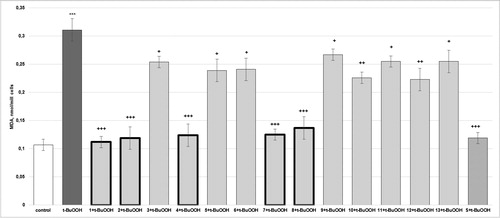
Figure 5. Effects of compounds 1–13 (at concentration 100 µmol/L), on synaptosomal viability, in 6-OHDA-induced oxidative stress (at concentration 150 µmol/L) in isolated rat synaptosomes. Each symbol indicates the mean ± SEM of six experiments. Statistically significant differences: ***p < 0.001 vs. control (non-treated synaptosomes); ++p < 0.01; +++p < 0.001 vs. 6-OHDA.
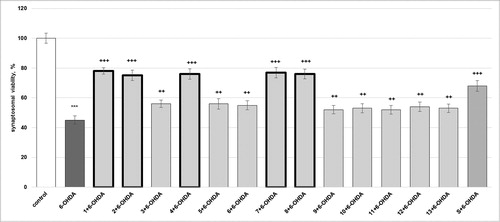
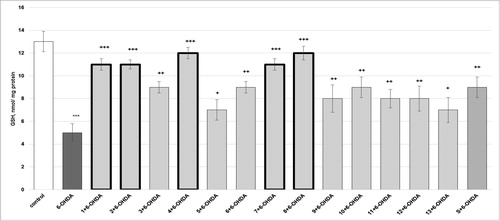
Figure 6. Effects of compounds 1–13 (at concentration 100 µmol/L), on GSH level, in 6-OHDA-induced oxidative stress (at concentration 150 µmol/L) in isolated rat synaptosomes. Each symbol indicates the mean ± SEM of six experiments. Statistically significant differences: *** p < 0.001 vs. control (non-treated synaptosomes); + p < 0.05; ++ p < 0.01; +++ p < 0.001 vs. 6-OHDA.