Figures & data
Figure 1. Effect of different concentrations of Tan IIA on proliferation and morphology of C4-1 cells. Cell growth inhibition (A) and morphology (B) of C4-1 cells.
Note: C4-1 cells were grown in DMEM with or without the indicated concentrations of Tan IIA for 5 days and were plated in 96-well plates. (A) Cell proliferation inhibition rate (CPIR) was calculated on day 5 based on MTT assay results. Data are expressed as mean values from three independent experiments. #P < 0.05, *P < 0.01 vs. the control, determined by ANOVA and post hoc Bonferroni multiple comparisons test. (B) Morphology of C4-1 cells with or without Tan IIA on day 5 was observed using inverted microscopy (magnification 50×).
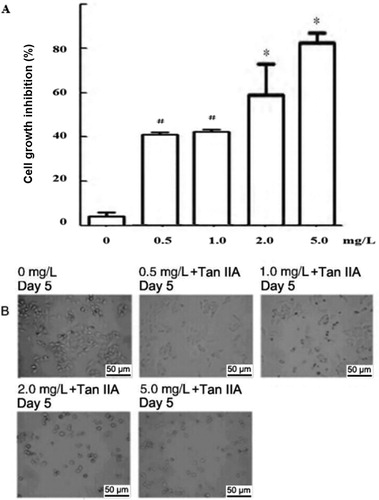
Table 1. Effect of Tan IIA treatment on proliferation of C4-1 cells.
Figure 2. Effects of different concentrations of Tan IIA on apoptosis of C4-1 cells.
Note: Cell apoptosis was assayed by flow cytometry using PI and FITC staining.
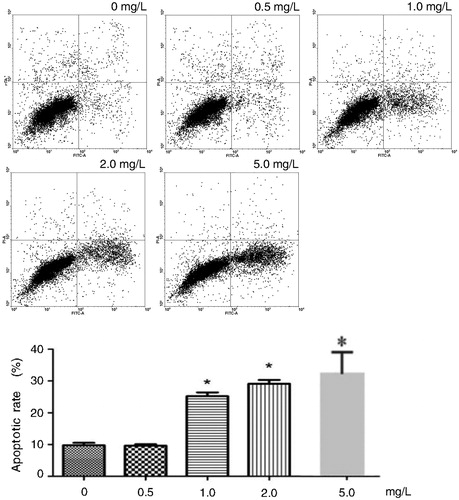
Figure 3. Effects of different concentrations of Tan IIA on expression of Bcl-2, Bax and Caspase-3 proteins in C4-1 cells.
Note: Protein expression levels were detected by Western blotting. GAPDH was used as internal control and normalized to 100%. The results were similar in three separate experiments. Quantitative analysis of the relative levels of target proteins was done using the NIH ImageJ software. #P < 0.05, *P < 0.01 vs. the control.
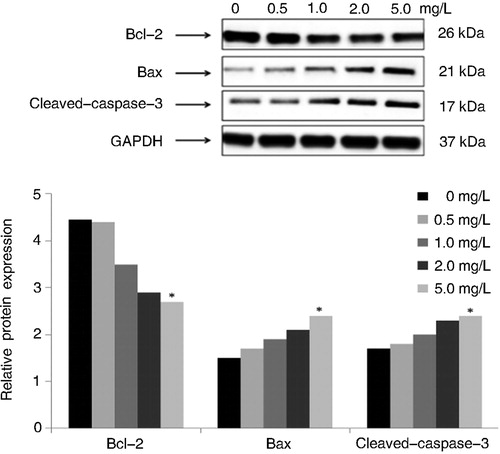
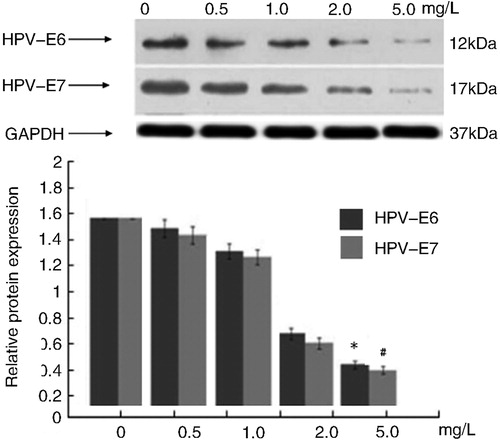
Figure 4. Effects of different concentrations of Tan IIA on protein expression of HPV E6/E7 in C4-1 cells.
Note: Protein expression levels were detected by Western blotting. GAPDH was used as internal control and normalized to 100%. The results were similar in three independent experiments. Quantitative analysis of the relative levels of target proteins was done using the NIH ImageJ software. P < 0.01 vs. the control.