
Figures & data
Figure 1. PRISMA flow diagram [Citation13].
![Figure 1. PRISMA flow diagram [Citation13].](/cms/asset/fa72e076-1d09-44bd-8bd5-eaa1b5f0f7b8/tbeq_a_1680317_f0001_c.jpg)
Table 1. Characteristics of the studies included in the systematic review.
Table 2. Economic burdens presented as annual per patient costs of acromegaly treatment.
Figure 2. Annual per patient costs in different countries inflated and based on 2018 exchange rates.
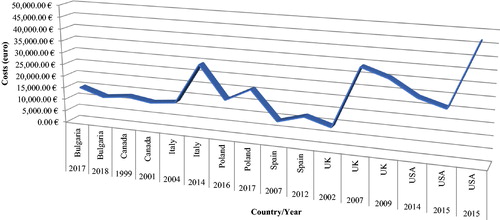
Table 3. Economic burden presented as annual acromegaly costs in absolute value and as % of GDP.