Figures & data
Table 1. OsDUF1191 genes and the properties of the putative proteins they encode.
Figure 1. Conservative structure analysis of rice OsDUF 1191 family. (A) Motif 1, motif 2 and motif 3 are conserved motifs of rice OsDUF1191 family obtained by MEME. (B) The distribution of conserved motifs identified by MEME software in OsDUF1191 members.
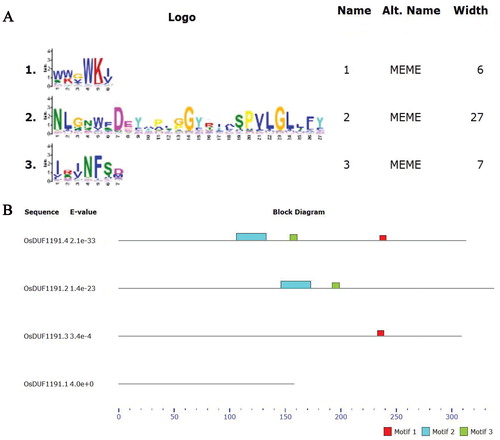
Figure 2. Phylogenetic relationship of OsDUF1191 members in rice and four DUF1191 members in Arabidopsis.
Note: The unrooted tree was generated using MEGA4.0 program by the maximum-likelihood method.
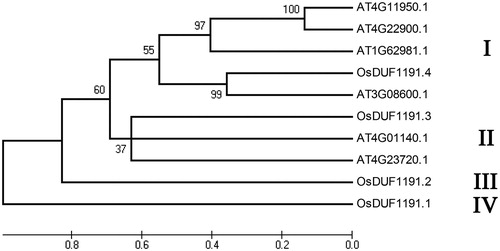
Figure 3. Real-time PCR analysis of OsDUF1191 genes in different tissues of Nipponbare rice. Fifteen representative tissues are as follows: Lb1, leaf blade at four-leaf stage; Lb2, leaf blade from plants with four tillers; Lb3, leaf blade at ripening stage; Ls1, leaf sheath at four-leaf stage; Ls2, leaf sheath from plants with four tillers; Rt1, root at four-leaf stage; Rt2, root from plants with four tillers; St1, stem from plants with four tillers; St2, stem at ripening stage; An, 1.2–1.5 mm anther; Pi, pistil from 10–14 cm inflorescence; Em1, embryo at 7 days after flowering; Em2, embryo at 28 days after flowering; En1, endosperm at 7 days after flowering; En2, endosperm at 28 days after flowering.
Note: The rice Actin1 transcript levels were used as internal controls. Error bars indicate standard error of the means based on three biological replicates.
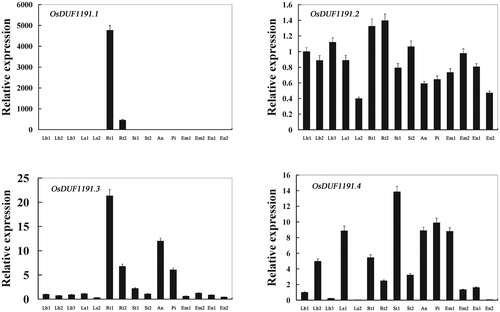
Figure 4. Relative expression levels of OsDUF1191 genes in Nipponbare rice seedlings at the emergence of the fourth leaf under various stress conditions and ABA treatment detected by real time PCR. D, drought; S, salt; C; cold; H, heat; A, ABA.
Note: For salt stress and drought stress, seedlings were sampled at 0, 4, 8 and 16 h. For ABA, heat and cold stress, seedlings were sampled at 0, 1, 3, 8 h. The rice Actin1 transcript levels were used as internal controls. Error bars indicate standard error of the means based on three biological replicates. **, P < 0.01 (Student’s t-test).
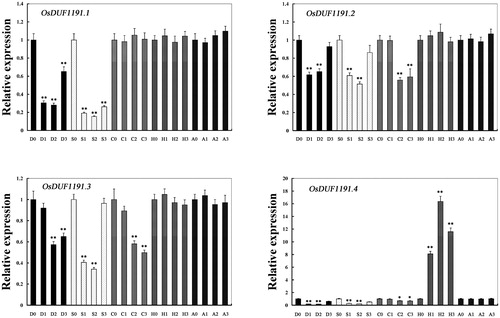
Figure 5. Growth of E. coli recombinants overexpresing OsDUF1191.4 under heat stress.
Note: 100-μL dilutions were spotted onto LB agar plates with 1 mmol/L IPTG at 0–2.5 h after heat shock (50 °C water bath), and then the number of the control (Rosetta/pET-32a) and recombinant (Rosetta/OsDUF1191.4) colonies was counted. Error bars indicate standard error of the means based on three biological replicates. **, P < 0.01 (Student’s t-test).
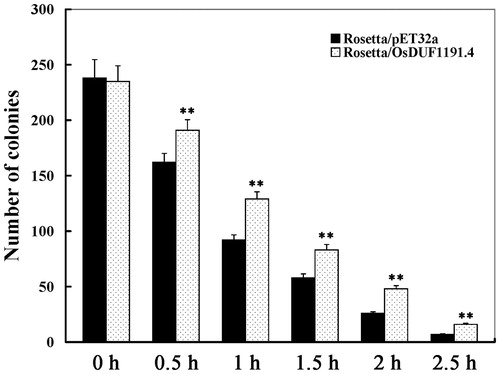
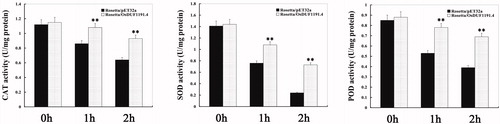
Figure 6. Antioxidant ability of E. coli transformants overexpressing OsDUF1191.4 under heat stress.
Note: After E. coli transformants were exposed to heat shock conditions (50 °C water bath) for 0, 1, and 2 h, respectively, catalase (CAT), superoxide dismutase (SOD) and peroxidase (POD) activities were determined. Error bars indicate standard error of the means based on three biological replicates. **, P < 0.01 (Student’s t test).