
Figures & data
Figure 1. Sevoflurane protected H9C2 cells from H/R-induced decrease of cell viability. H9c2 cells were exposed to 1 h and 2 h of 2.5% sevoflurane 24 h before H/R for 24 h followed by H/R. Cell viability was measured with CCK8 assay. Data are represented as mean values ± SEM. ***p < 0.001 vs. control group, #p < 0.05, ##p < 0.01 vs. H/R group. H/R, hypoxia/reoxygenation; Sev, sevoflurane.
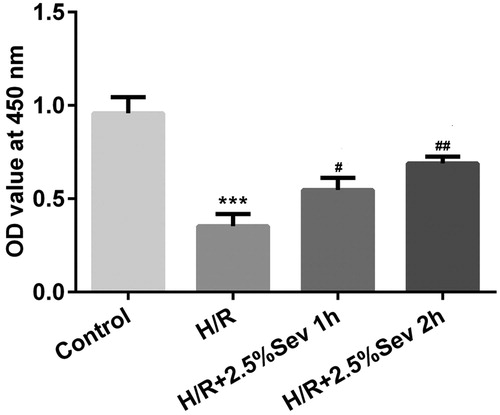
Figure 2. Sevoflurane inhibited H9C2 cells from H/R-induced apoptosis. H9C2 cells were exposed to 1 h and 2 h of 2.5% sevoflurane for 24 h followed by H/R. (A) The apoptotic ratio of H9C2 cells was detected by flow cytometry. (B) The protein levels of Bcl-2 and Mcl1 were detected by western blot. Data are represented as means ± SEM. ***p < 0.001 vs. control group, #p < 0.05, ##p < 0.01, ###p < 0.001 vs. H/R group. H/R, hypoxia/reoxygenation; Sev, sevoflurane.
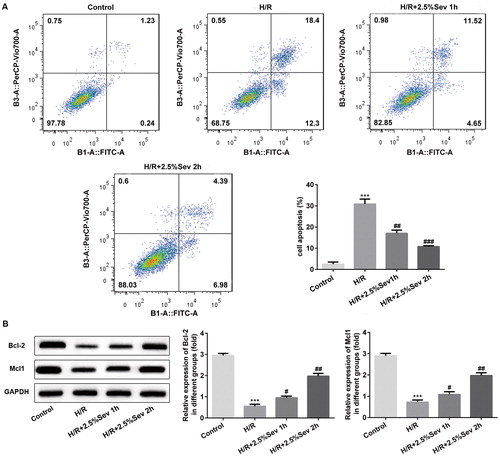
Figure 3. Sevoflurane inhibited inflammation of H9C2 cells induced by H/R injury. The protein levels of TNF-α, IL-1β, IL-6 and IL-10 were detected by western blot. GAPDH served as an internal loading control. Data are represented as means ± SEM. ***p < 0.001 vs. control group, #p < 0.05, ##p < 0.01, ###p < 0.001 vs. H/R group. H/R, hypoxia/reoxygenation; Sev, sevoflurane.
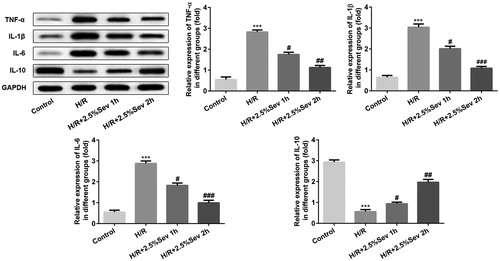
Figure 4. Sevoflurane mitigated H/R-induced increase of NO production. (A) The level of NO was measured by ELISA assay. (B) The protein level of iNOS was measured by western blot. GAPDH served as an internal loading control. Data are represented as means ± SEM. ***p < 0.001 vs. control group, #p < 0.05, ##p < 0.01 vs. H/R group. H/R, hypoxia/reoxygenation; Sev, sevoflurane.
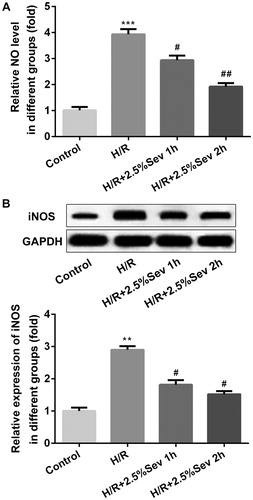
Figure 5. Sevoflurane activated AKT/Pim-1 and AKT/GSK3β signaling pathway. The protein levels of p-AKT, t-AKT, PIM1, P-Bad, p-GSK3β, t-GSK3β and cyclin D1 were detected by western blot. GAPDH served as an internal loading control. Data are represented as means ± SEM. ***p < 0.001 vs. control group, #p < 0.05, ##p < 0.01, ###p < 0.001 vs. H/R group. H/R, hypoxia/reoxygenation; Sev, sevoflurane.
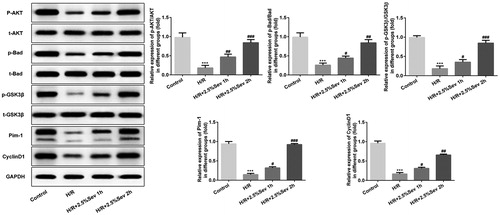
Figure 6. Sevoflurane inhibited H/R-induced inflammation in H9C2 cells via AKT/Pim-1 and AKT/GSK3β signaling pathway. In 2.5% sevoflurane (Sev) 2 h group, H9C2 cells were exposed to 2 h of 2.5% sevoflurane 24 h before H/R treatment; 2.5% sevoflurane (Sev) 2 h + LY294002 group, H9C2 cells were pretreated with 10 μL LY294002 for 24 h before sevoflurane treatment. The protein levels of TNF-α, IL-1β, and IL-6 were detected by western blot. GAPDH served as an internal loading control. Data are represented as means ± SEM. ***p < 0.001 vs. control group, #p < 0.05, ##p < 0.01, ###p < 0.001 vs. H/R group. H/R, hypoxia/reoxygenation; Sev, sevoflurane; LY, phosphoinositide-3-kinase inhibitor LY294002.
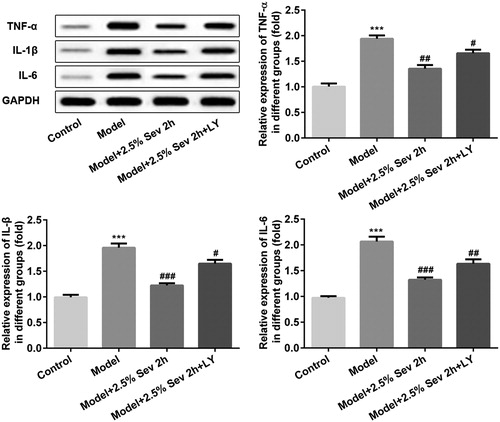
Figure 7. Sevoflurane mitigated H/R-Induced NO production via AKT/Pim-1 and AKT/GSK3β signaling pathway. In 2.5% sevoflurane (Sev) 2 h group, H9C2 cells were exposed to 2 h of 2.5% sevoflurane 24 h before H/R treatment; 2.5% sevoflurane (Sev) 2 h + LY294002 group, H9C2 cells were pretreated with 10 μL LY294002 for 24 h before sevoflurane treatment. (A) The level of NO was measured by ELISA assay. (B) The protein level of iNOS was measured by western blot. GAPDH served as an internal loading control. Data were represented as means ± SEM. ***p < 0.001 vs. control group, ##p < 0.01, ###p < 0.001 vs. H/R group. H/R, hypoxia/reoxygenation; Sev, sevoflurane; LY, phosphoinositide-3-kinase inhibitor LY294002.
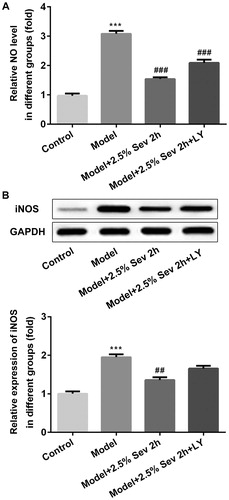
Figure 8. Sevoflurane inhibited H9C2 cells from H/R-induced apoptosis via AKT/Pim-1 and AKT/GSK3β signaling pathway. In 2.5% sevoflurane (Sev) 2 h group, H9C2 cells were exposed to 2 h of 2.5% sevoflurane 24 h before H/R treatment; 2.5% sevoflurane (Sev) 2 h + LY294002 group, H9C2 cells were pretreated with 10 μL LY294002 for 24 h before sevoflurane treatment. (A) The apoptotic ratio of H9C2 cells was detected by flow cytometry. (B) Quantitative analysis of apoptotic rate. Data are represented as means ± SEM. ***p < 0.001 vs. control group, ##p < 0.01 vs. H/R group. H/R, hypoxia/reoxygenation; Sev, sevoflurane; LY, phosphoinositide-3-kinase inhibitor LY294002.
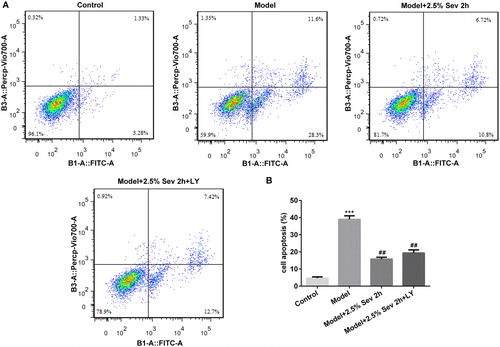
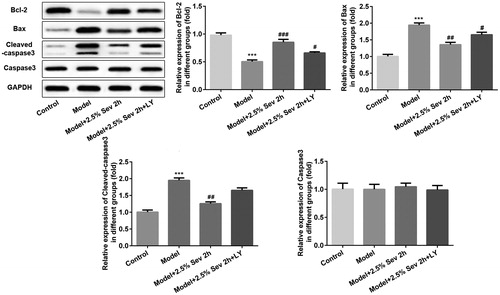
Figure 9. Sevoflurane inhibited H9C2 cells from H/R-induced apoptosis via AKT/Pim-1 and AKT/GSK3β signaling pathway. In 2.5% sevoflurane (Sev) 2 h group, H9C2 cells were exposed to 2 h of 2.5% sevoflurane 24 h before H/R treatment; 2.5% sevoflurane (Sev) 2 h + LY294002 group, H9C2 cells were pretreated with 10 μL LY294002 for 24 h before sevoflurane treatment. The expression levels of apoptosis-associated proteins such as Bcl-2, Bax, cleaved capase3 and capase3 were further assessed by western blot analysis. GAPDH served as an internal loading control. Data are represented as means ± SEM. ***p < 0.001 vs. control group, #p < 0.05, ##p < 0.01, ###p < 0.001 vs. H/R group. H/R, hypoxia/reoxygenation; Sev, sevoflurane; LY, phosphoinositide-3-kinase inhibitor LY294002.
Availability of data and materials
The analyzed data sets generated during the present study are available from the corresponding author upon reasonable request.