Figures & data
Table 1. Geographical characteristics of sampling locations of Iranian T. urartu accessions in this study.
Table 2. Start Codon Targeted (SCoT) and CAAT-box derived polymorphism (CBDP) primers and their amplification results generated in the 85 T. urartu accessions.
Table 3. Estimated genetic diversity parameters for different Iranian T. urartu populations using SCoT and CBDP markers.
Table 4. Analysis of molecular variance (AMOVA) in T. urartu populations.
Figure 1. Fan-dendrogram generated using neighbour-joining clustering based on SCoT (A), CBDP (B) and SCoT + CBDP (C) data. See for codes of genotypes.
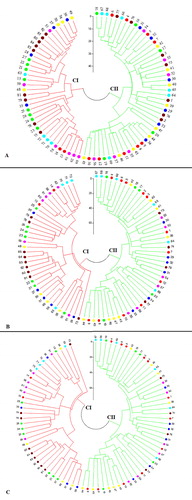
Figure 2. Biplot derived from the PCoA of the 85 Iranian T. urartu accessions based on SCoT (A), CBDP (B) and SCoT + CBDP (C) data.
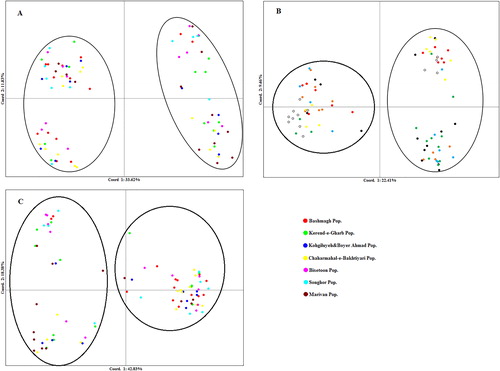
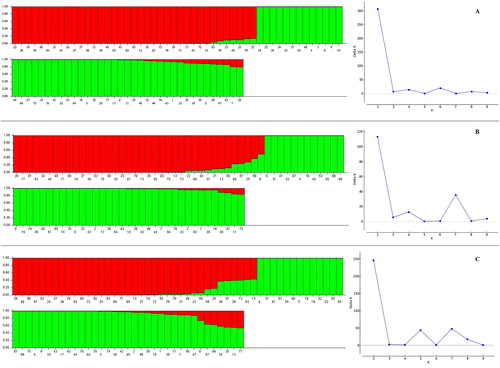
Figure 3. Population structure of 85 accessions of T. urartu based on SCoT (A), CBDP (B) and SCoT + CBDP (C) primers inferred by STRUCTURE analysis. See for codes of genotypes.