
Figures & data
Figure 1. Effect of propofol on the biological functions of HUVECs with I/R. (A) Proliferation of HUVECs without I/R (NC group), HUVECs with I/R (I/R group) and HUVECs with I/R that were treated with propofol. CCK-8 assay was used to determine cell proliferation. *p < 0.05 compared with NC group; #p < 0.05 compared with I/R group. (B) Migration ability of HUVECs in NC group, I/R group and I/R + propofol group. Transwell assay was used to determine cell migration. *p < 0.05 compared with NC group; #p < 0.05 compared with I/R group. (C) Apoptosis of HUVECs NC group, I/R group and I/R + propofol group. Flow cytometry was used to determine cell apoptosis. *p < 0.05 compared with NC group; #p < 0.05 compared with I/R group.
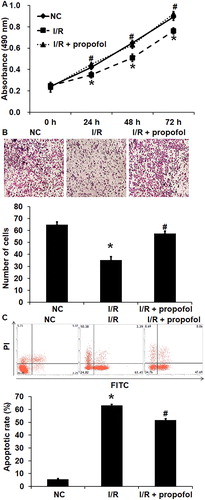
Figure 2. Effect of propofol on the expression of SUMO2/3 in HUVECs with I/R. (A,B) Expression of SUMO2 (A) and SUMO3 (B) mRNA in HUVECs without I/R (NC group), HUVECs with I/R (I/R group) and HUVECs with I/R that were treated with propofol. qRT-PCR was used to determine mRNA expression. *p < 0.05 compared with NC group; #p < 0.05 compared with I/R group. (B) Expression of SUMO2/3 proteins in HUVECs of NC group, I/R group and I/R + propofol group. Western blotting was used to determine protein expression. *p < 0.05 compared with NC group; #p < 0.05 compared with I/R group.
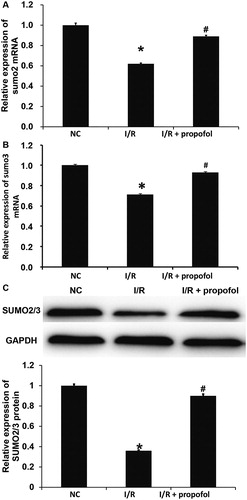
Figure 3. The effect of SUMO2/3 inhibition on the biological functions of HUVECs. (A) Expression of SUMO2/3 proteins in HUVECs transfected with siR-NC or siR-SUMO2/3. Western blotting was used to determine protein expression. *p < 0.05 compared with siR-NC group. (B) Proliferation of HUVECs transfected with siR-NC or siR-SUMO2/3. CCK-8 assay was used to examine cell proliferation. *p < 0.05 compared with siR-NC group. (C) Migration ability of HUVECs transfected with siR-NC or siR-SUMO2/3. Transwell assay was used to examine cell migration. *p < 0.05 compared with siR-NC group. (C) Apoptosis of HUVECs transfected with siR-NC or siR-SUMO2/3. Flow cytometry was used to examine cell apoptosis. *p < 0.05 compared with siR-NC group.
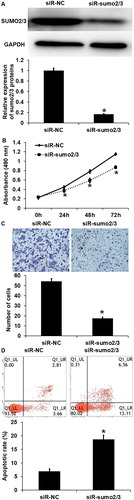
Figure 4. Effect of propofol on the autophagy of untransfected HUVECs and those without or with interference of SUMO2/3 expression. (A) Expression of LC3B II and p62 proteins in HUVECs of control group, propofol group, propofol + siR-NC group and propofol + siR-SUMO2/3 group. Western blotting was used to determine protein expression. *p < 0.05 compared with control group; #p < 0.05 compared with propofol + siR-NC group. (B) Number of autophagosomes in HUVECs of control group, propofol group, propofol + siR-NC group and propofol + siR-SUMO2/3 group. Laser scanning confocal microscopy was used to determine the number of autophagosomes. *p < 0.05 compared with control group; #p < 0.05 compared with propofol + siR-NC group.
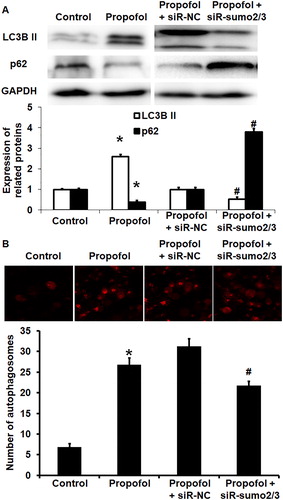
Figure 5. Identification of modification of K26 site of Beclin1 by SUMO2/3. (A) Bioinformatics prediction of SUMO modification sites in Beclin1 gene. (B) Protein immunoprecipitation analysis of SUMO site K26 in Beclin1. Wild-type or K26R Beclin1 immunoprecipitated with SUMO2/3.
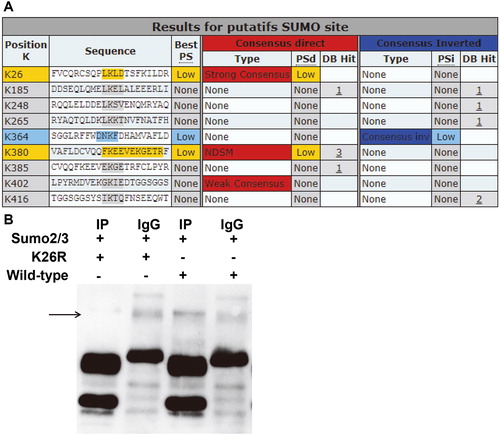
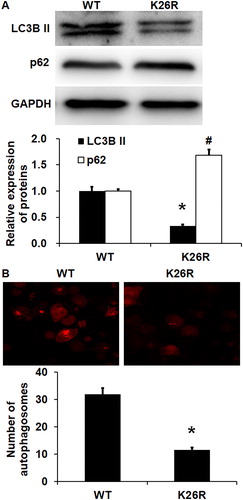
Figure 6. Effect of wild-type (WT) or K26R Beclin1 on the autophagy of HUVECs. (A) Expression of LC3B II protein and p62 protein in HUVECs with WT or K26R Beclin1. Western blotting was used to determine protein expression. *p < 0.05 compared with WT group for LC3B II protein; #p < 0.05 compared with WT group of p62 protein. (B) Number of autophagosomes in HUVECs with WT or K26R Beclin1. Laser scanning confocal microscopy was used to determine the number of autophagosomes. *p < 0.05 compared with WT group for LC3B II protein; #p < 0.05 compared with WT group of p62 protein.
Availability of data and materials
The datasets used and/or analyzed in this study are available from the corresponding author upon reasonable request.