Figures & data
Figure 1. Relative expression of PAI-1 mRNA in PC. (A) Relative expression of PAI-1 mRNA in tumor tissues from PC patients with or without diabetes and tumor-adjacent tissues from all PC patients. *p < 0.05 and **p < 0.01 compared with tumor-adjacent tissues. #p < 0.05 compared with tumor tissues from PC patients without diabetes. Relative expression of PAI-1 mRNA in serum (B) and urine (C) from PC patients with or without diabetes. *p < 0.05 and **p < 0.01 compared with PC patients without diabetes. qRT-PCR was used to determine the expression of mRNA.
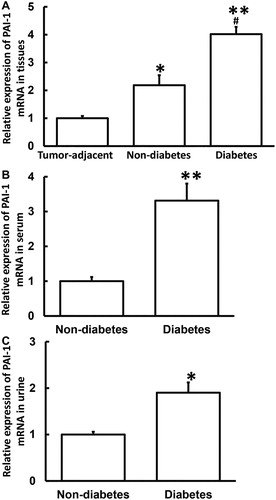
Figure 2. Relative expression of PAI-1 protein in tumor tissues from PC patients with or without diabetes and tumor-adjacent tissues from all PC patients. Western blotting was used to determine the expression of protein in tissues. *p < 0.05 and **p < 0.01 compared with tumor-adjacent tissues. ##p < 0.01 compared with tumor tissues from PC patients without diabetes.
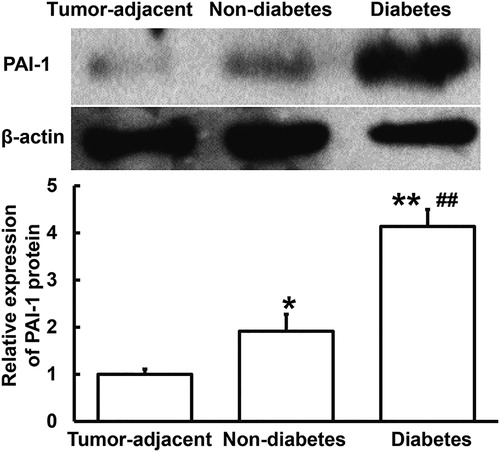
Figure 3. Relative expression of PAI-1 protein in serum (A) and urine (B) from PC patients with or without diabetes. ELISA was used to determine the content of protein (ng/mL). *p < 0.05 and **p < 0.01 compared with PC patients without diabetes.
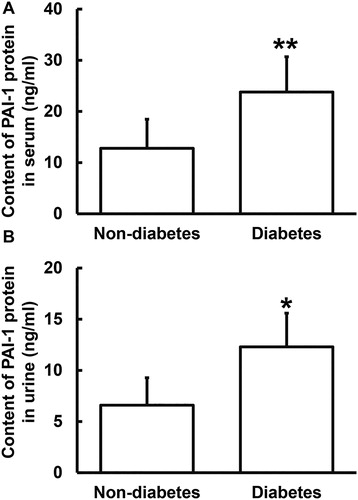
Figure 4. Relative expression of miR-30b in PC. (A) Relative expression of miR-30b in tumor tissues from PC patients with or without diabetes and tumor-adjacent tissues from all PC patients. *p < 0.05 compared with tumor-adjacent tissues. #p < 0.05 compared with tumor tissues from PC patients without diabetes. Relative expression of miR-30b in serum (B) and urine (C) from PC patients with or without diabetes. *p < 0.05 and **p < 0.01 compared with PC patients without diabetes. qRT-PCR was used to determine the expression of miR-30b.
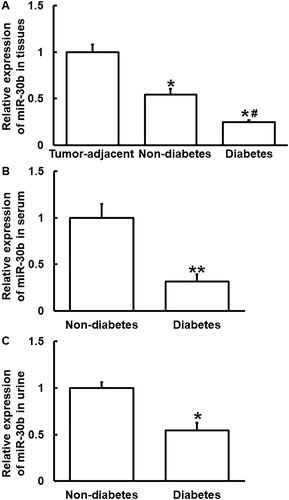
Figure 5. Identification of interaction between miR-30b and PAI-1 mRNA. (A) Bioinformatics prediction (miRanda) of genes that might regulate PAI-1. (B) Dual luciferase reporter assay. Plasmids (0.8 μg) with wild-type or mutant 3′-UTR sequences were co-transfected with agomiR-30b into 293 T cells. For control, 293 T cells were transfected with agomiR-negative control (NC) according to the manufacturer’s manual, and luminescence intensity was measured using GloMax 20/20 luminometer (Promega). Renilla luminescence activity was used as internal reference. **p < 0.01 compared with NC group.

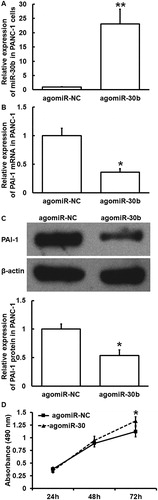
Figure 6. Effect of miR-30b overexpression on the expression of PAI-1 in PC cells (PANC-1) and the proliferation of islet β-cells (INS-1). (A) Expression of miR-30b in PANC-1 cells after transfection with agomiR-NC or agomiR-30b. **p < 0.01 compared with agomiR-NC group. Expression of PAI-1 mRNA (B) and protein (C) in PANC-1 cells after transfection with agomiR-NC or agomiR-30b. *p < 0.05 compared with agomiR-NC group. (D) Proliferation of INS-1 cells after stimulation by culture supernatant of PANC-1 cells transfected with agomiR-NC or agomiR-30b. MTT assay was used to determine cell proliferation. *p < 0.05 compared with agomiR-NC group.