Figures & data
Table 1. Primer sequences for RT-PCR.
Figure 1. Lewis lung tumour volumes in mouse model. Experimental group (n = 10) received caudal vein injection of 1 × 10⁶ hucMSCs each week for consecutive two weeks. Control group (n = 10) received caudal vein injection of equal amount of saline at the same time. *p < 0.05 compared with control group at the same time point.
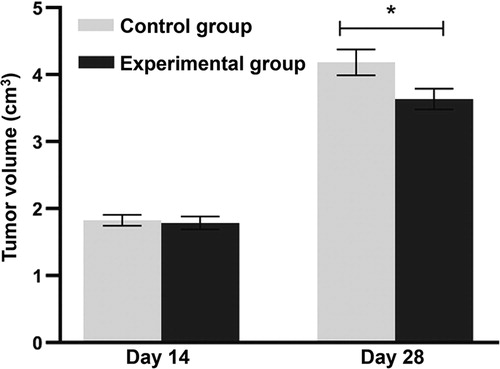
Table 2. Comparison of tumour weight and thymus index.
Figure 2. Contents of inflammatory factors IL-1, IL-6 and TNF-α in tumour tissues from mice. Experimental group (n = 10) received caudal vein injection of 1 × 10⁶ hucMSCs each week for consecutive two weeks. Control group (n = 10) received caudal vein injection of equal amount of saline at the same time. ELISA was used to determine IL-1, IL-6 and TNF-α contents in lung cancer tissues. *p < 0.05.
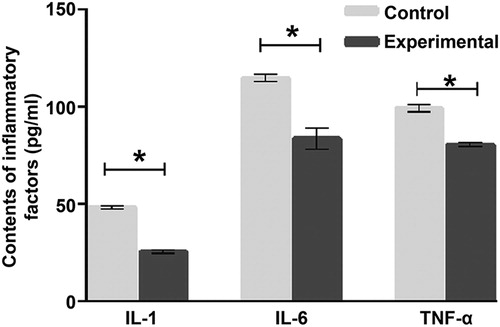
Figure 3. Relative expression of TLR4, NF-κB, Bcl-2, Bax, IL-6, IL-1 and TNF-α mRNA in tumour tissues from mice. Experimental group (n = 10) received caudal vein injection of 1 × 10⁶ hucMSCs each week for consecutive two weeks. Control group (n = 10) received caudal vein injection of equal amount of saline at the same time. RT-PCR was used to measure the level of mRNA. *p < 0.05.
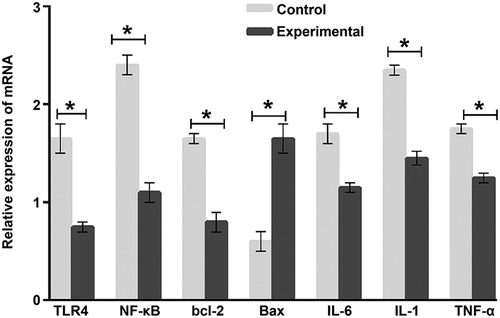
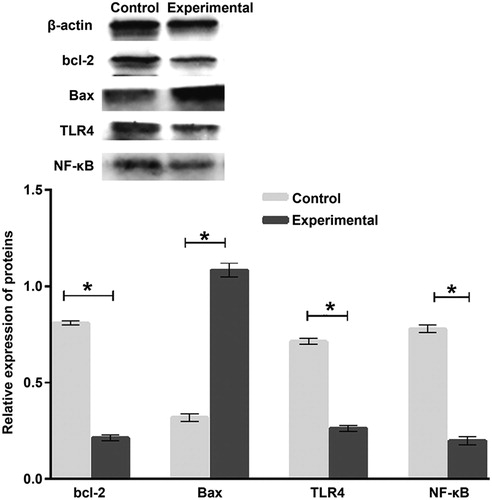
Figure 4. Relative expression of Bcl-2, Bax, TLR4 and NF-κB proteins in tumour tissues from mice. Experimental group (n = 10) received caudal vein injection of 1 × 10⁶ hucMSCs each week for consecutive two weeks. Control group (n = 10) received caudal vein injection of equal amount of saline at the same time. Western blotting was used to determine protein expression. *p < 0.05.