Figures & data
Table 1. Primers used for qRT-PCR assays.
Figure 1. Distribution of the 14 Solanum lycopersicum carbonic anhydrase (SlCA) genes on tomato chromosomes. Note: ▲ denotes reverse transcription and ▼ denotes forward transcription. The red line indicates a tandem repeat.
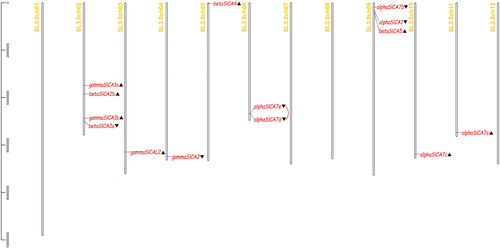
Figure 2. Phylogenetic tree, conserved motifs and gene structures of Solanum lycopersicum carbonic anhydrases (SlCAs). Note: The evolutionary history of the SlCA genes was inferred using the Maximum Likelihood method based on the JTT matrix-based model (left). The tree is drawn to scale, with branch lengths measured in terms of the number of substitutions per site. Evolutionary analyses were conducted using MEGA X. To the right of the tree are schematic representations of the conserved motifs in SlCA proteins identified using MEME (center). The non-conserved sequences are indicated by gray lines, and each motif is indicated by a different colored box. Each of the three sub-clades of CA proteins contains similar conserved motifs. Gene structure of SlCAs (right). The gray lines, green boxes, and other colored boxes represent introns, UTR regions, and exons, respectively. The figure also shows the CA protein domains.
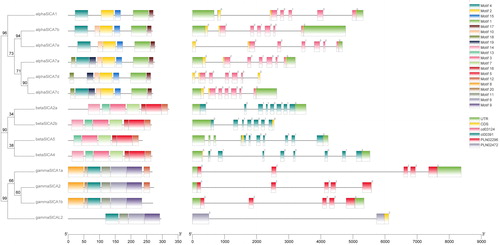
Figure 3. The conserved domains of Solanum lycopersicum carbonic anhydrase (SlCA) proteins. Note: The non-conserved sequences are represented by gray lines and the CA domains are represented by colored bars. The PLN02296 and PLN2472 domains are found in the γ-CAs.
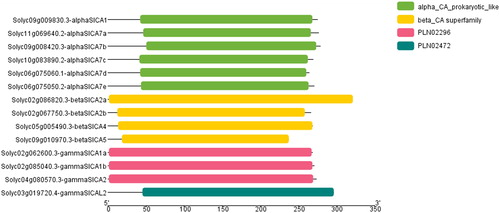
Figure 4. An unrooted phylogenetic tree of carbonic anhydrase proteins in tomato, rice and Arabidopsis. Note: The tree was constructed with MEGA X software using the Maximum Likelihood method based on a JTT matrix-based model. The α, β, and γ clades are shown in orange, green and purple, respectively. All the Solanum lycopersicum carbonic anhydrase (SlCA) proteins are shown in red.
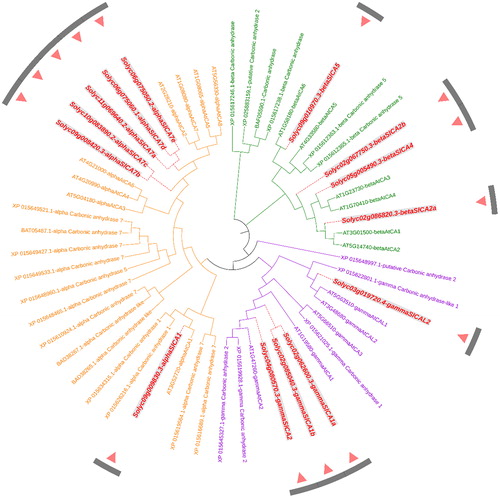
Figure 5. An unrooted phylogenetic tree of carbonic anhydrase protein sequences in tomato, potato, and tobacco. Note: The phylogenetic tree was constructed with MEGA X software using the Maximum Likelihood method according to the JTT matrix-based model. The α, β, and γ clades are shown in orange, green, and purple, respectively. All the Solanum lycopersicum carbonic anhydrase (SlCA) proteins are shown in red.
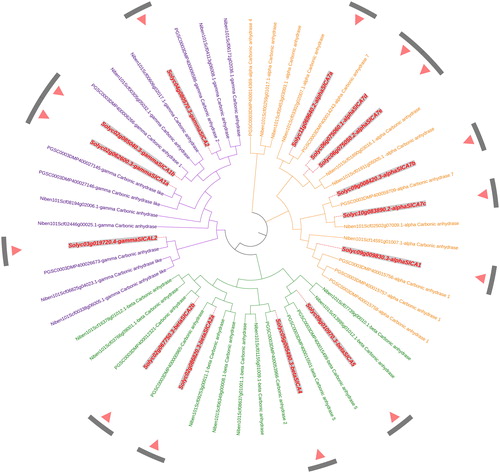
Figure 6. Chromosomal distribution and synteny analysis of the Solanum lycopersicum carbonic anhydrase (SlCA) genes. Note: The curved yellow bars represent the chromosome as indicated. Gene IDs are based on gene positions on the chromosomes. Putative whole-genome duplications are indicated by gray lines and segmentally duplicated genes are indicated by red lines.
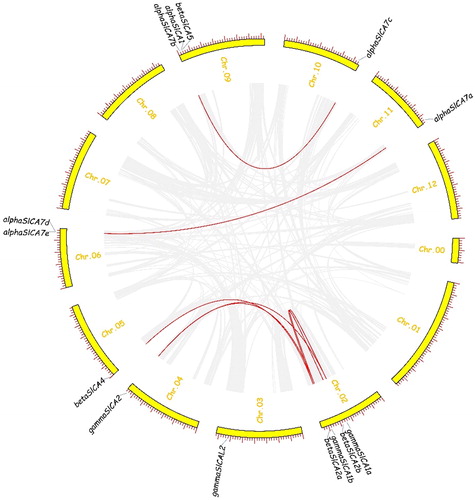
Table 2. Comparative analysis of the Ka, Ks, and Ka/Ks values of Solanum lycopersicum carbonic anhydrase (SlCA) genes.
Figure 7. Expression patterns of Solanum lycopersicum carbonic anhydrase (SlCA) genes in different tissues of S. lycopersicum (Heinz1706) and S. pimpinellifolium (LA1589). Note: The row data for RNA-seq were obtained from a public database and analyzed using TBtools. The expression levels of SlCA genes are shown in terms of RPKM values. The expression values were mapped using a color gradient from low (white) to high (red). The α, β, and γ clades are indicated by pink, orange and yellow bars, respectively. Heinz 1706 is indicated by a cyan bar, and LA1589 is indicated by a gray bar.
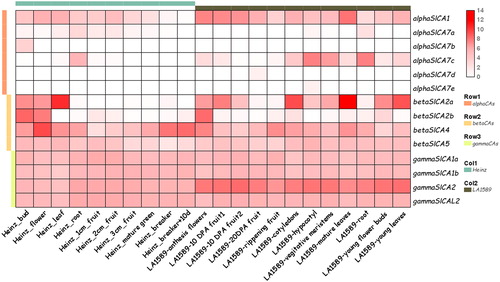
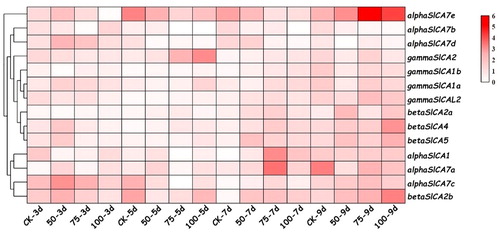
Figure 8. Expression patterns of Solanum lycopersicum carbonic anhydrase (SlCA) genes in leaves of the cultivar micro-TOM in response to different salt treatments. Note: As salt treatments, seedlings were grown in nutrient solution containing 0 (control), 50, 75, or 100 mM NaCl, and samples were collected for analysis at 0, 3, 5, 7 and 9 days after the initiation of treatment. The cluster analysis heat map was drawn using TBtools. The expression levels of the SlCA genes are presented as fold-change values converted to the Log2 format. The data represent the relative expression levels normalized to that of the housekeeping gene Actin2 and are the mean values of three independent biological repetitions. The expression values were mapped using a color gradient from low (white) to high (red).