Figures & data
Table 1. Quality assessment of the sequencing results of each library.
Table 2. Screening of differentially expressed genes (DEGs).
Figure 1. Gene ontology (GO) analysis of differentially expressed genes (DEGs) from tomato. A total of 130 DEGs were categorized into 242 function items.
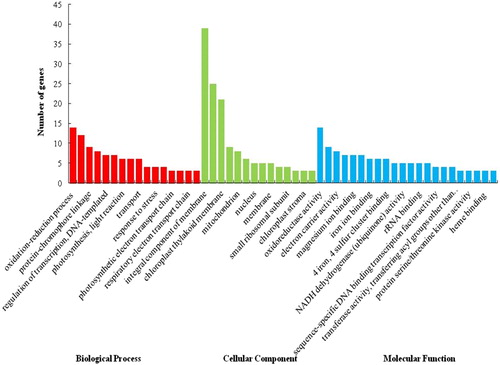
Figure 2. Kyoto Encyclopedia of Genes and Genomes (KEGG) analysis of differentially expressed genes (DEGs) from tomato. A total of 21 signalling pathways were identified.
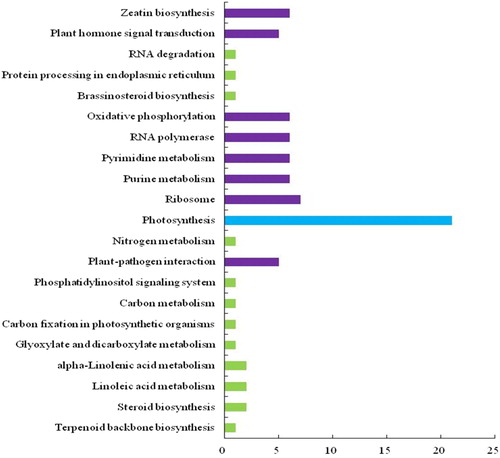
Table 3. Identification of key genes related to photosynthesis and sugar synthesis.
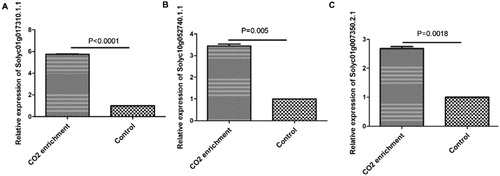
Figure 3. Quantitative real-time PCR validation of RNA-Seq results. Three genes were randomly selected: Solyc01g017310.1.1 (A), Solyc10g052740.1.1 (B) and Solyc01g007350.2.1 (C). Actin was used as the internal control gene.