
Figures & data
Table 1. Lycorine inhibited HepG 2 cell proliferation in vitro.
Figure 1. Morphology of HepG-2 cells with or without lycorine treatment in vitro. Inverted microscopy (magnification 10 × 40). Cells treated with lycorine 3 μmol/L (A), 6 μmol/L (B) or 12 μmol/L (C); Control (D); Cells treated with 4 μmol/L HCPT (E).
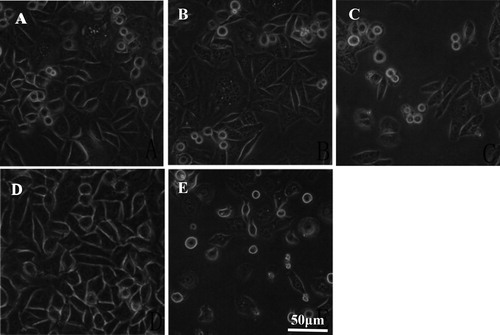
Figure 2. Morphology of HepG-2 cells with or without lycorine treatment in vitro. Fluorescence microscopy (magnification 10 × 40). Cells treated with lycorine 3 μmol/L (A), 6 μmol/L (B) or 12 μmol/L (C); Control (D); Cells treated with 4 μmol/L HCPT (E).
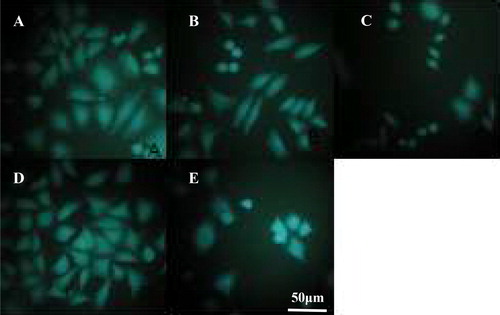
Figure 3. HepG-2 cell death rate in vitro. Flow cytometry. Cells treated with lycorine 3 μmol/L (A), 6 μmol/L (B) or 12 μmol/L (C); Control (D); Cells treated with 4 μmol/L HCPT (E).
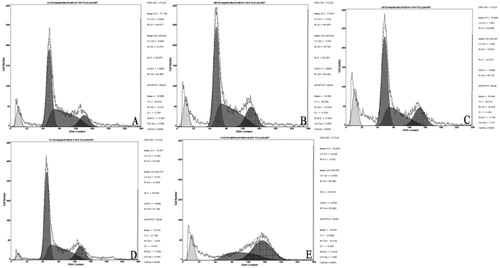
Table 2. Effect of Lycorine on cell membrane components of hepatocellular carcinoma HepG-2 cells in vitro ( n = 6).
Table 3. Effect of lycorine on tumor cell membrane fluidity and integrity ( n = 6).
Table 4. Effect of lycorine on tumor cell membrane ATP activity in vitro ( n = 6).
Table 5. Effect of lycorine on tumor growth and length of life of H22 tumor-bearing mice ( n = 20).
Figure 4. Cell death rate of tumor cells in H22 tumor-bearing mice. Treatment with lycorine 10 mg/kg (A), 20 mg/kg (B), 40 mg/kg (C); Control (D); hydroxycamptothecin treatment (E).
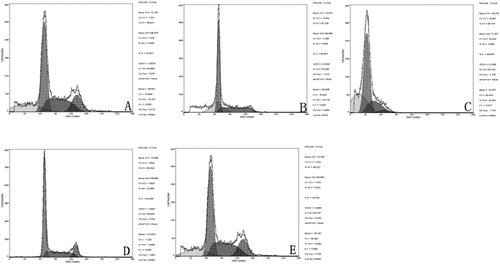
Table 6. Effect of lycorine on H22 tumor-bearing mice tumor cell membrane composition ( n = 20).
Table 7. Effect of lycorine on tumor cell membrane fluidity and membrane integrity in H22 tumor-bearing mice ( n = 20).
Table 8. Lycorine impact on tumor cell membrane ATP activity.