Figures & data
Figure 1. Expression of miR-449a in IBD. The expression level of miR-449a in IBD was detected using qRT-PCR. A: Relative miR-449a expression in colonic mucosa of 30 children with IBD or 30 children without IBD (** p < 0.01 vs. non-IBD); B: Relative miR-449a in the normal intestinal epithelial cells Caco-2 treated with or without DSS (**p < 0.01 vs. Control group). Data are displayed as mean values ± SD.
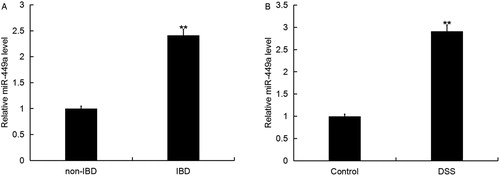
Figure 2. Notch1 was a direct target of miR-449a. A: Interaction between miR-449a and 3’UTR of Notch1 was predicted using microRNA target site prediction software; B: Luciferase activity of a reporter containing a wild-type Notch1 3’UTR or a mutant Notch1 3’UTR are presented. “Notch1-MUT” indicates the Notch1 3’UTR with a mutation in the miR-449a binding site. UTR, untranslated region. All data are presented as mean values ± SD of three independent experiments. **p < 0.01 vs. mimic control group.
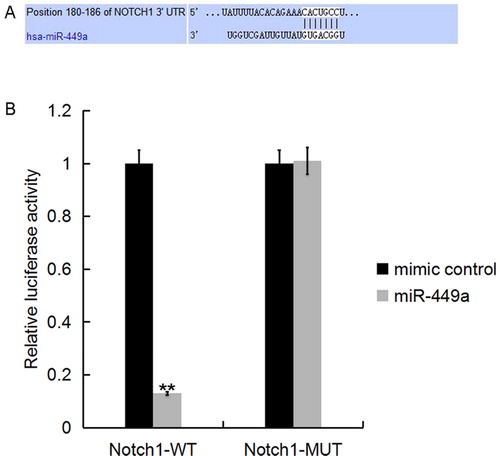
Figure 3. miR-449a inhibitor increased Notch1 expression in Caco-2 cells. A: Relative miR-449a expression in Caco-2 cells in different groups; B and D: Relative Notch1 mRNA expression in Caco-2 cells in different groups; C and E: Protein level of Notch1 in Caco-2 cells in different groups. Data are displayed as mean values ± SD. ** p < 0.01 vs. control group; # p < 0.05 vs. inhibitor group.
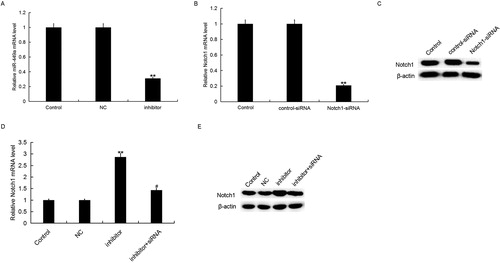
Figure 4. Effect of miR-449a inhibitor on TNF-α, IL-1β and IL-6 expression in Caco-2 cells. After specific treatment, the mRNA (A–C) and protein (D) level of TNF-α, IL-1β and IL-6 in Caco-2 cells in different groups was detected using qRT-PCR and western blot, respectively. Control: Caco-2 cells without any treatment; DSS: Caco-2 cells were treated with 2% DSS; DSS + NC: Caco-2 cells were treated with 2% DSS and transfected with the negative control of miR-449a inhibitor; DSS + inhibitor: Caco-2 cells were treated with 2% DSS and transfected with miR-449a inhibitor; DSS + inhibitor + siRNA: Caco-2 cells were treated with 2% DSS and co-transfected with miR-449a inhibitor and Notch1-siRNA. Data are displayed as mean values ± SD. **p < 0.01 vs. control group; #p < 0.05 vs. DSS group; &p < 0.05 vs. DSS + inhibitor group.
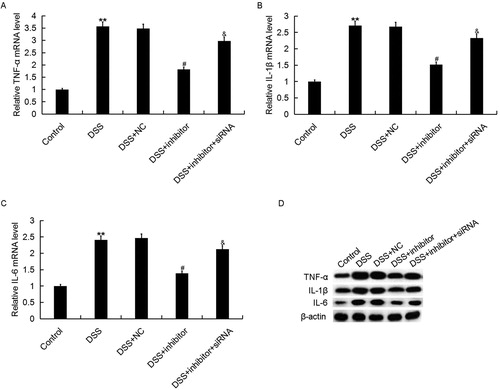
Figure 5. Effect of miR-449a inhibitor on Caco-2 cell proliferation ability. After specific treatment, Caco-2 cell proliferation ability was assessed by using MTT assay. Control: Caco-2 cells without any treatment; DSS: Caco-2 cells were treated with 2% DSS; DSS + NC: Caco-2 cells were treated with 2% DSS and transfected with the negative control of miR-449a inhibitor; DSS + inhibitor: Caco-2 cells were treated with 2% DSS and transfected with miR-449a inhibitor; DSS + inhibitor + siRNA: Caco-2 cells were treated with 2% DSS and co-transfected with miR-449a inhibitor and Notch1-siRNA.Data are displayed as mean values ± SD. **p < 0.01 vs. control group; #p < 0.05 vs. DSS group; &p < 0.05 vs. DSS + inhibitor group.
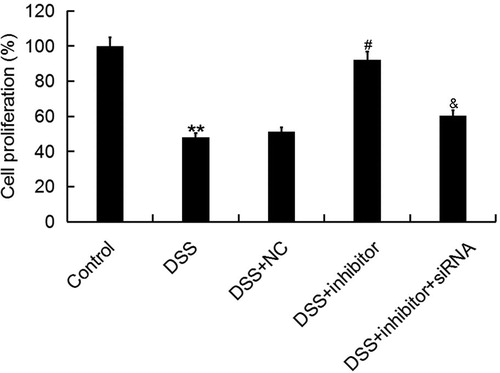
Figure 6. Effect of miR-449a inhibitor on Caco-2 cell apoptosis. After specific treatment, Caco-2 cell apoptosis (early apoptosis + late apoptosis) was assessed by using FCM assay (A), and the data were analyzed (B). C: protein level of Bcl-2 and Bax in different groups. Control: Caco-2 cells without any treatment; DSS: Caco-2 cells were treated with 2% DSS; DSS + NC: Caco-2 cells were treated with 2% DSS and transfected with the negative control of miR-449a inhibitor; DSS + inhibitor: Caco-2 cells were treated with 2% DSS and transfected with miR-449a inhibitor; DSS + inhibitor + siRNA: Caco-2 cells were treated with 2% DSS and co-transfected with miR-449a inhibitor and Notch1-siRNA.Data were displayed as mean ± SD. **p < 0.01 vs. control group; #p < 0.05 vs. DSS group; &p < 0.05 vs. DSS + inhibitor group.
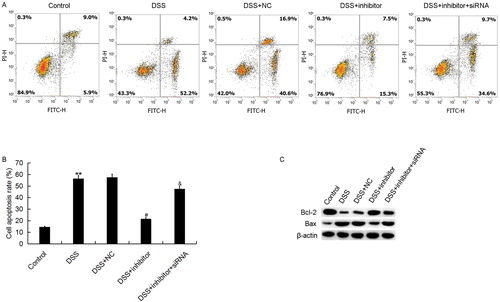
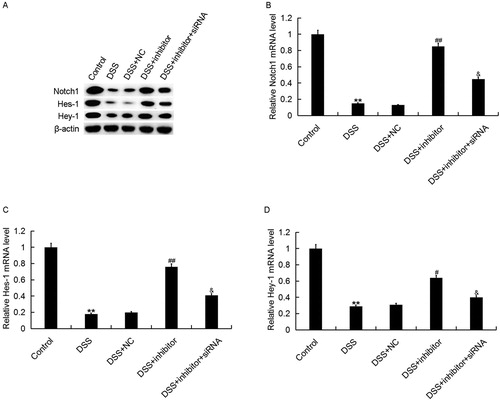
Figure 7. Effect of miR-449a inhibitor on Notch1 pathway in Caco-2 cells. After specific treatment, the protein (A) and mRNA (B–D) level of Notch1, Hes-1 and Hey-1 in Caco-2 cells in different groups was detected using western blot and qRT-PCR, respectively. Control: Caco-2 cells without any treatment; DSS: Caco-2 cells were treated with 2% DSS; DSS + NC: Caco-2 cells were treated with 2% DSS and transfected with the negative control of miR-449a inhibitor; DSS + inhibitor: Caco-2 cells were treated with 2% DSS and transfected with miR-449a inhibitor; DSS + inhibitor + siRNA: Caco-2 cells were treated with 2% DSS and co-transfected with miR-449a inhibitor and Notch1-siRNA. Data are displayed as mean values ± SD. **p < 0.01 vs. control group; #, ##p < 0.05, 0.01 vs. DSS group; &p < 0.05 vs. DSS + inhibitor group.