Figures & data
Figure 1. Expression of miR-124-3p in the brain tissue of rats with HIE. (A and B) Protein levels of the molecular markers related to the development of HIE, S100 calcium-binding protein B (S100B) and neuron-specific enolase (NSE), in the brain tissue of rats with or without HIE. (C and D) Cell apoptosis in the brain tissue of rats with or without HIE. (E) miR-124-3p expression in the brain tissue of rats with or without HIE.
Note: Data are mean values ± SD. **p < 0.01 vs. control group.
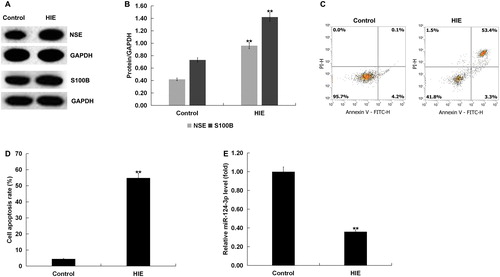
Figure 2. Bax was a target gene of miR-124-3p. (A) Binding sites of miR-124-3p to Bax. (B) miR-124-3p expression in neurons transfected with miR-124-3p mimic or mimic control. (C) Dual-luciferase reporter system was used to confirm the binding sites between miR-124-3p and Bax. (D and E) Protein and mRNA expression of Bax in the brain tissue of rats with or without HIE.
Note: Data are mean values ± SD. **p < 0.01 vs. control group; ##p < 0.01 vs. mimic control group.
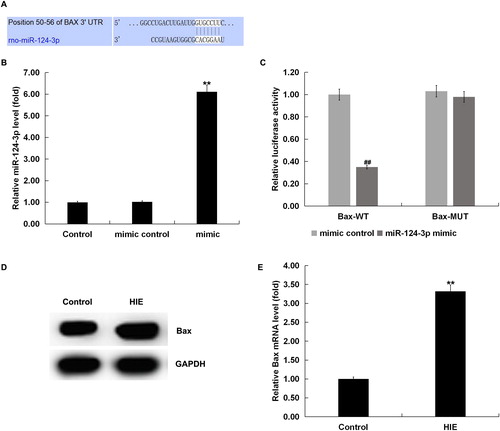
Figure 3. miR-124-3p and Bax expression in OGD-induced neurons. After 48 h of OGD induction, the expression of miR-124-3p and the mRNA and protein expression of Bax in the neurons were detected. (A) miR-124-3p expression in OGD-induced neurons. (B and C) Bax mRNA and protein expression in OGD-induced neurons.
Note: Data are mean values ± SD. **p < 0.01 vs. control group.
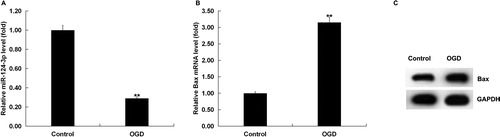
Figure 4. Effect of miR-124-3p on Bax expression in neurons. Neurons were transfected with miR-124-3p mimic, mimic control, Bax-plasmid, control-plasmid, miR-124-3p mimic + control-plasmid or miR-124-3p mimic + Bax-plasmid, respectively. (A and B) mRNA and protein expression of Bax in neurons transfected with Bax-plasmid or control-plasmid. (C and D) mRNA and protein expression of Bax in neurons transfected with miR-124-3p mimic, mimic control, miR-124-3p mimic + control-plasmid or miR-124-3p mimic + Bax-plasmid.
Note: Data are mean values ± SD. **p < 0.01 vs. control group. ##p < 0.01 vs. mimic group.
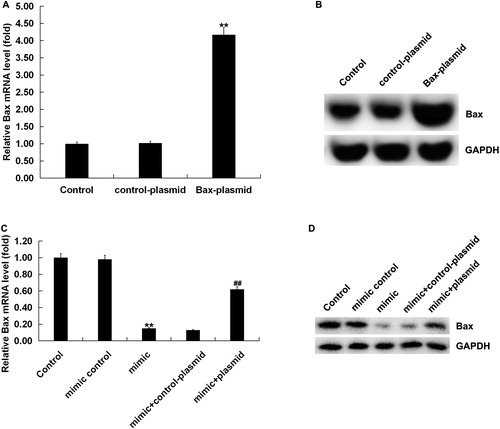
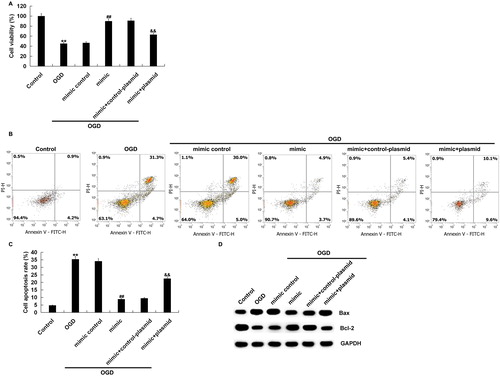
Figure 5. Effect of miR-124-3p on OGD-induced neuronal injury. Neurons were transfected with miR-124-3p mimic, mimic control, miR-124-3p mimic + control-plasmid or miR-124-3p mimic + Bax-plasmid. After 48 h, the cells were subjected to OGD induction for 48 h. Then, cell viability (A), cell apoptosis (B and C), and the expression of Bcl-2 and Bax in neurons were detected (D).
Note: Data are mean values ± SD. **p < 0.01 vs. control group. ##p < 0.01 vs. OGD group. &&p < 0.01 vs. mimic + OGD group.