Figures & data
Figure 1. Comparison of common structural indexes in PARP-1 in four different species. Note: H = Human, B = Bovine, M = Mouse, R = Rat.
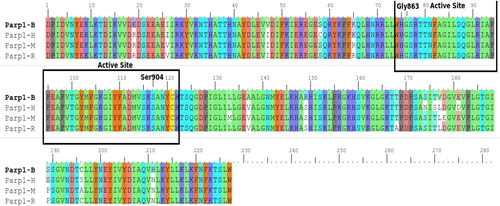
Figure 2. Comparison of PARP-2 amino acid sequences in human and mouse. Note: H = Human, M = Mouse.
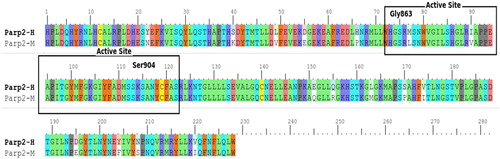
Figure 3. Sequence alignment of PARP4 with template PDB ID 6fpy.
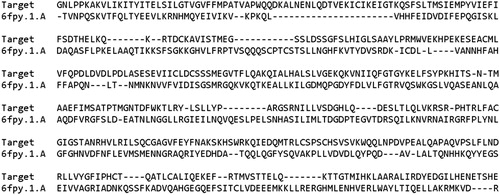
Figure 4. Local Similarity and Qmean analysis of PARP-4.
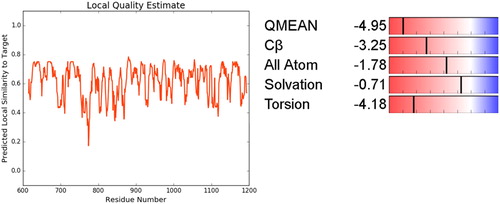
Figure 5. Secondary structure (A) and surface structure (B) of PARP4.
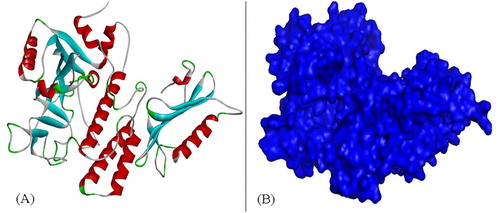
Figure 6. Ramachandran plot for PARP4, Ramachandran contour plot depicting Φ and Ψ angles. Source: http://mordred.bioc.cam.ac.uk/∼rapper/rampage.php.
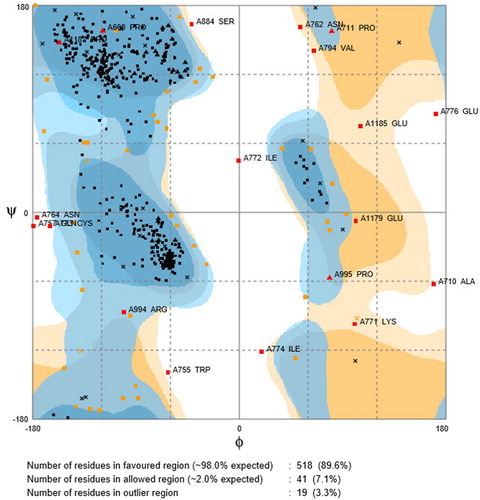
Figure 7. Molecular dynamics calculations of PARP4.
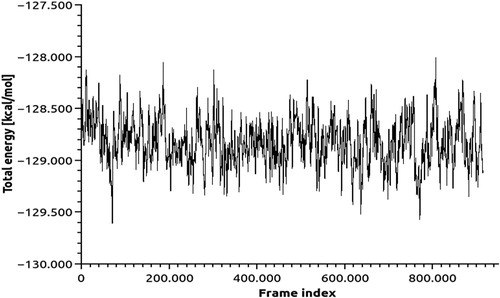
Figure 8. Flexibility calculations of PARP4 RMSF analysis.
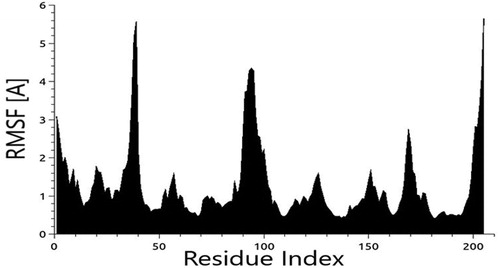
Figure 9. Interaction residue (A) and area (B) of PARP4-NAD.
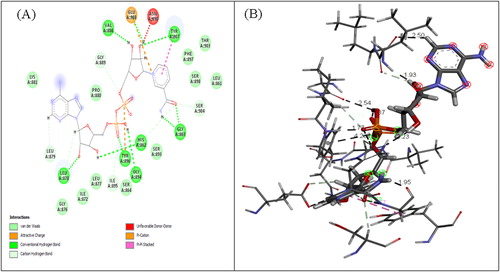
Figure 10. Active site determination based on common structural motif that recognizes the NAD region of PARPs belonging to human, rat and mouse.
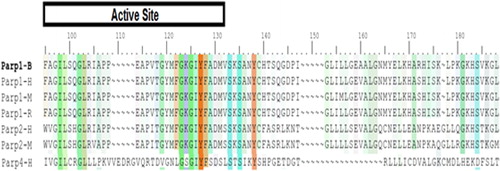
Figure 11. Folding analysis of PARPs (1, 2, 3, 4, 6, 11) binding NAD.
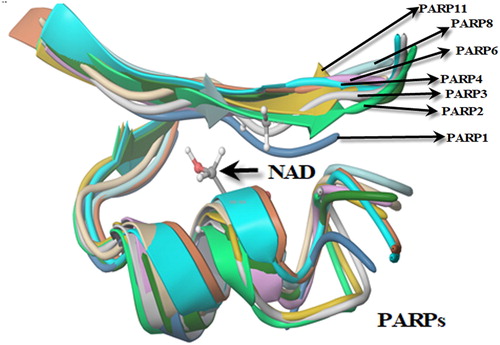
Figure 12. Secondary structure of PARP1 (A) and PARP2 (B) with NAD interaction.
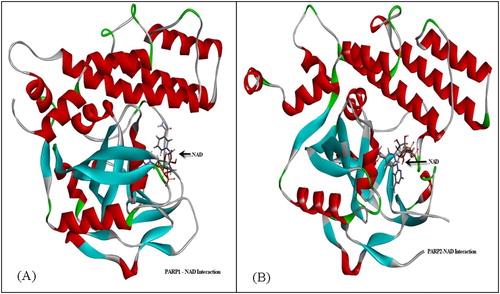
Table 1. Comparative RMSD values of PARP1, PARP and PARP4 (°A).
Table 2. Catalytic sites from PARPs with the highest probability of interaction with NAD.
Figure 13. Electrophoresis (A) and chromatography (B) analysis of PARP1 and PARP2. Note: For electrophoresis analysis, 5 μg protein was loaded to gel.
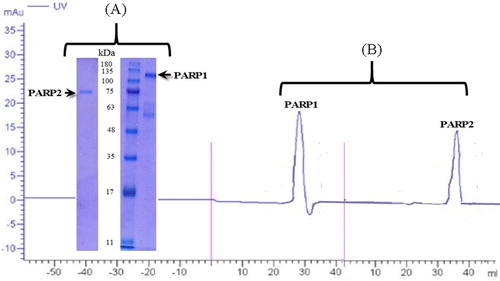
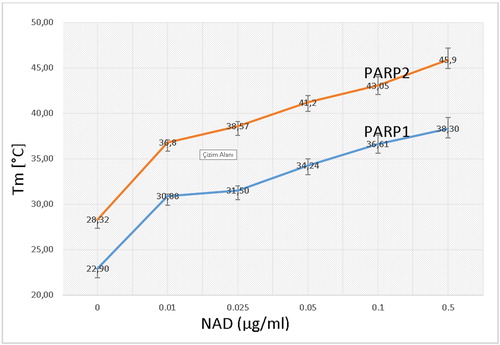
Figure 14. PARP1-NAD interaction was tested with thermal shift assay. Melting temperatures of PARP1-NAD interaction (Tm values).
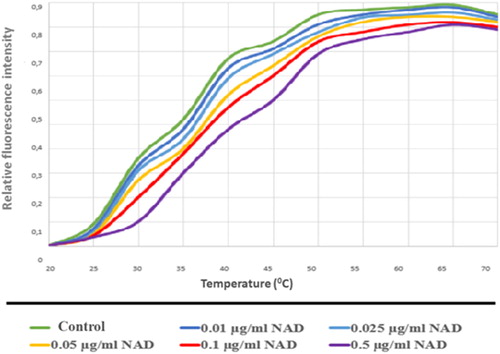
Figure 15. PARP2-NAD interaction was tested with thermal shift assay. Melting temperatures PARP2-NAD interaction (Tm values).
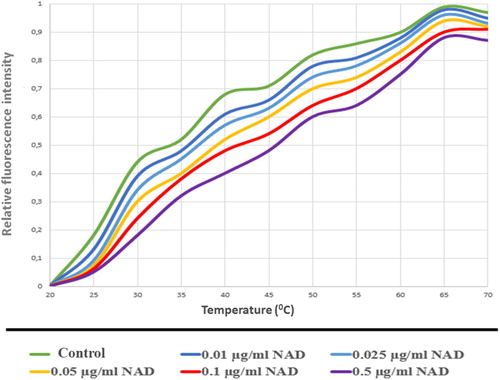
Figure 16. Interaction graph of PARP1 and PARP2 with NAD. (10 µg/ml PARP1, PARP2 and NAD in increasing concentrations).