Figures & data
Figure 1. Immunophenotypic characterisation of human bone marrow-derived MSC at passage three. (a) MSC cultures (n = 8) were highly positive for CD29, CD73, CD90 and CD105, and negative for CD45. Results are presented as mean ± SD. (b) Representative flow cytometry histograms of the fundamental surface markers used to define MSC.
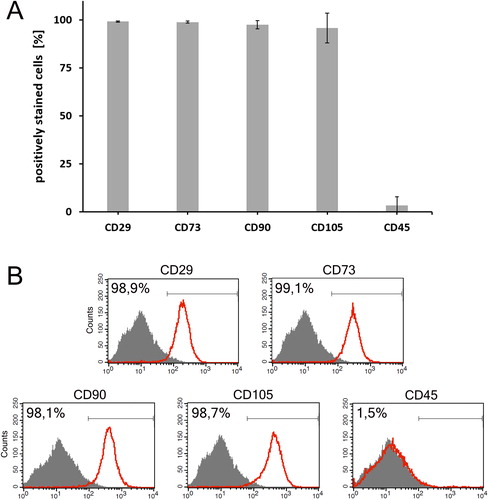
Figure 2. Characterization of MSC cultured on polystyrene plastic surface. (a) Growth kinetics curve. (b–k) Differentiation potential; Osteogenesis was displayed by calcium deposition (d, e) visualized with Alizarin Red staining (f and g are non-induced controls; magnification: d and f - × 100, e and g - × 200) and (b) measured quantitatively by ALP assay (results are shown as mean ± SD of 3 independent experiments; *p < 0.05). (h, i) Adipogenic differentiation was indicated by the accumulation of neutral lipid vacuoles stained with Oil Red O (j and k are non-induced controls; magnification, × 100) and (c) further quantitatively confirmed (results are presented as mean ± SD of 3 independent experiments; *p < 0.05).
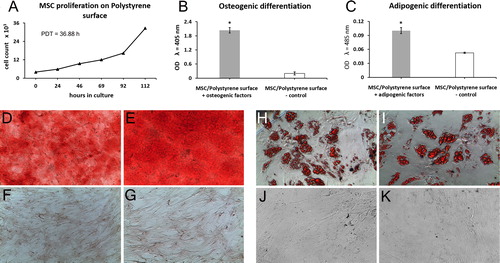
Figure 3. Representative fluorescence images of morphological and immunophenotypic characteristics of human bone marrow-derived MSC cultured on Ti-6Al-4V alloy specimens (left panel) and β-TCP granules (right panel). Cells were visualized by staining nuclei with Hoechst 33258 alone or in combination with specific antibodies against some of the surface markers characteristic for MSC. Scale bar = 100 μm. H, Hoechst.
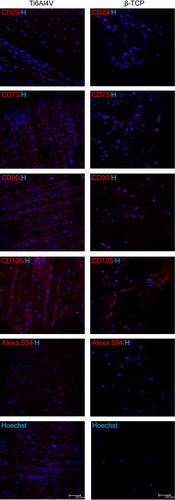
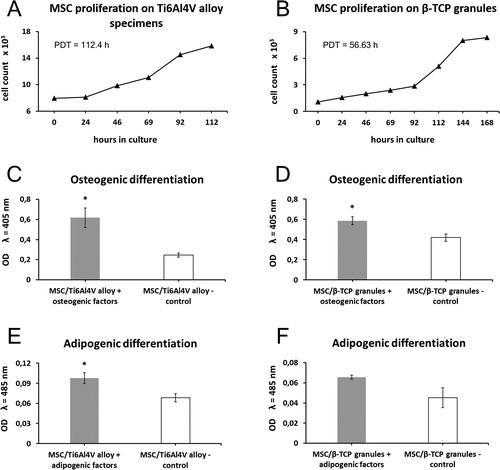
Figure 4. Proliferation ability and differentiation potential of MSC cultured on Ti-6Al-4V alloy (a, c, e) and β-TCP (b, d, f). (a and b) MSC proliferation profiles on Ti-6Al-4V alloy specimens (a) and β-TCP granules (b) evaluated with Alamar Blue assay. (c and d) Differentiation towards osteogenic lineage quantitatively demonstrated by ALP assay. (e and f) Quantification of adipogenic differentiation by measuring the absorbance of Oil red O eluates. Data are presented as mean ± SD; *p < 0.05.