
Figures & data
Figure 1. Relative expression of MCP-1 mRNA in cartilage tissues (A), serum (B) and synovial fluid (C) from patients with cartilage injury of elbow joint of upper limbs. Note: qRT-PCR was used to determine the expression of mRNA. GAPDH was used as internal reference, and expression of target gene in each group was divided by that of GAPDH. Then, the value of experimental group was normalized to control group. *p < 0.05 and **p < 0.01 compared with control group.
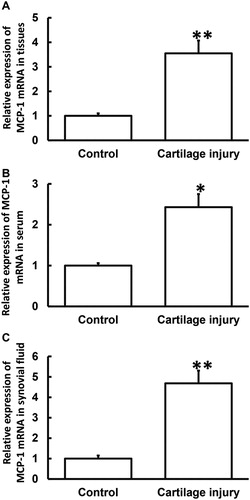
Figure 2. Relative expression of MCP-1 protein in cartilage tissues from patients with cartilage injury of elbow joint of upper limbs. Note: Western blotting was used to determine the expression of protein in the tissues. β-actin was used as internal reference, and expression of target gene in each group was divided by that of β-actin. Then, the value of experimental group was normalized to control group. *p < 0.05 compared with control group.
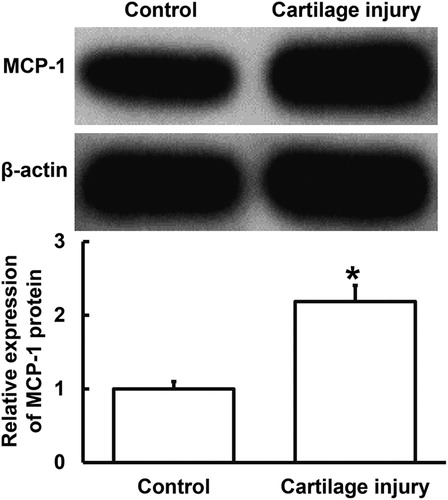
Figure 3. Relative expression of MCP-1 protein in serum (A) and synovial fluid (B) from patients with cartilage injury of elbow joint of upper limbs. Note: ELISA was used to determine the content of protein (pg/mL). *p < 0.05 and **p < 0.01 compared with control group.
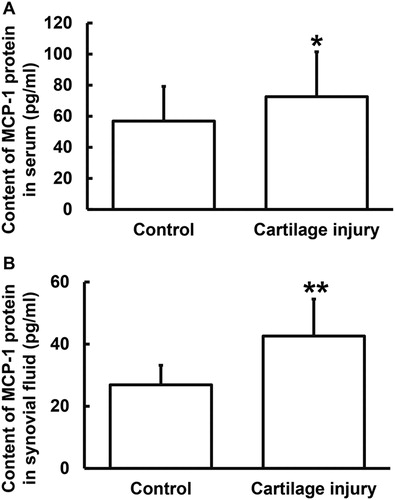
Figure 4. Relative expression of miR-421 in cartilage tissues (A), serum (B) and synovial fluid (C) from patients with cartilage injury of elbow joint of upper limbs. Note: qRT-PCR was used to determine the expression of miR-421. U6 was used as internal reference, and expression of target gene in each group was divided by that of U6. Then, the value of experimental group was normalized to control group. *p < 0.05 and **p < 0.01 compared with control group.
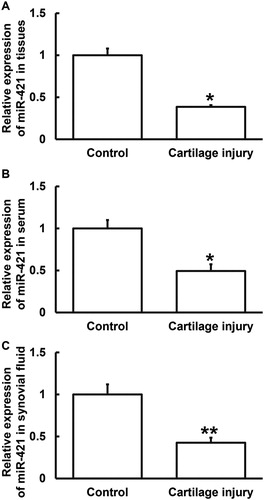
Figure 5. Identification of interaction between miR-421 and MCP-1 mRNA. (A) Bioinformatics prediction (miRanda) of genes that might regulate MCP-1. (B) Dual luciferase reporter assay. Note: Plasmids (0.8 μg) with wild-type or mutant 3′-UTR sequences were co-transfected with agomiR-421 into 293T cells. For control, 293T cells were transfected with agomiR-negative control (NC). Renilla luminescence activity was used as internal reference to determine the luminescence values of each group of cells. **p < 0.01 compared with NC group.
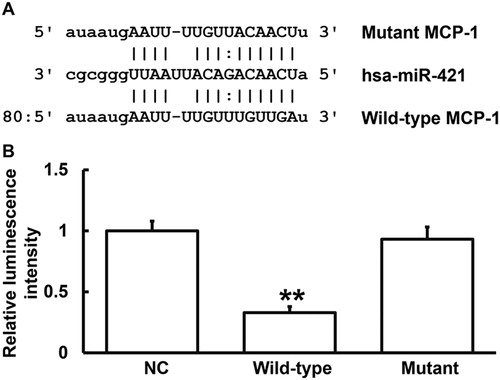
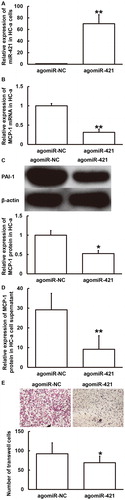
Figure 6. Effect of miR-421 overexpression on the expression of MCP-1 in HC-a cells (A–D) and the migration of THP-1 cells (E). (A) Expression of miR-421 in HC-a cells after transfection with agomiR-NC or agomiR-421. **p < 0.01 compared with agomiR-NC group. (B, C) Expression of MCP-1 mRNA (B) and protein (C) in HC-a cells after transfection with agomiR-NC or agomiR-421. *p < 0.05 and **p < 0.01 compared with agomiR-NC group. (D) Content of MCP-1 protein in supernatant of HC-a cells after transfection with agomiR-NC or agomiR-421. **p < 0.01 compared with agomiR-NC group. (E) Number of migrated THP-1 cells after stimulation by culture supernatant of HC-a cells transfected with agomiR-NC or agomiR-421. Transwell assay was used to determine cell migration. *p < 0.05 compared with agomiR-NC group.
Availability of data and materials
The datasets used and/or analyzed during this study are available from the corresponding author upon reasonable request.