Figures & data
Table 1. Overview of the LOX gene family in the F. tataricum genome.
Figure 1. Multiple alignment of LOX amino acid sequences from F. tataricum and other plants (A–C). Note: Black dots represent the characteristic amino acids of 9-LOXs.
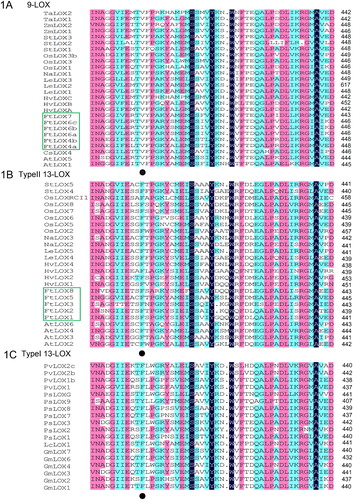
Figure 2. Phylogenetic analysis of LOX members from 14 species. Note: Evolutionary relationships were inferred using the neighbor-joining method (with 1,000 bootstrap replicates). Branches corresponding to partitions that were reproduced in less than 50% of the bootstrap replicates were collapsed.
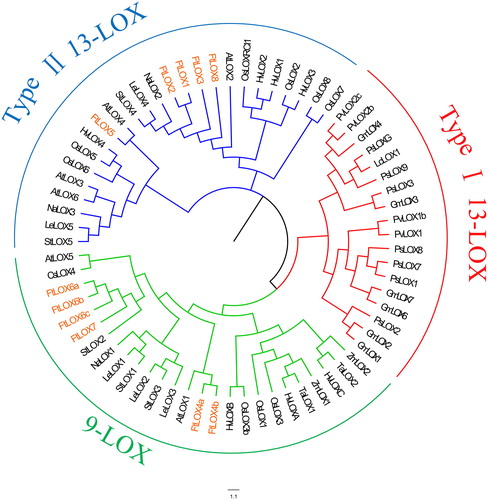
Figure 3. FtLOX gene features. (A) Chromosomal locations of FtLOX members. The length of each chromosome is shown. (B) Gene structure of FtLOX genes. (C) Codon usage patterns in FtLOX genes.
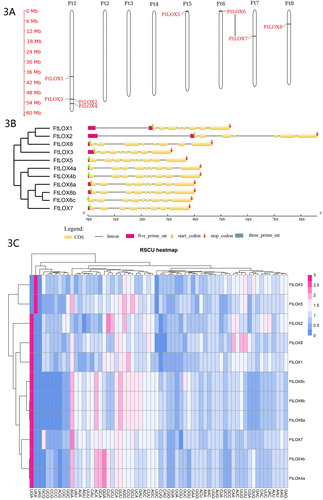
Figure 4. Analysis of FtLOXs. (A) Analysis of functional domains of FtLOXs. The motif analysis was performed using TBtools. LOX proteins are listed on the left. Squares in different colors represent different motifs in each LOX sequence. (B) Distribution of cis-elements in the promoter regions (−2,000 bp) of the eight FtLOX genes. Different colors represent different elements.
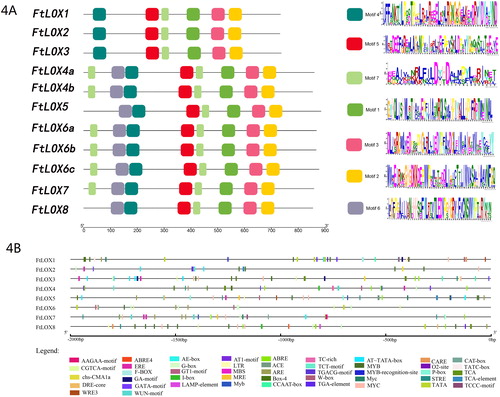
Table 2. Physical and chemical properties of Tartary buckwheat LOX proteins.
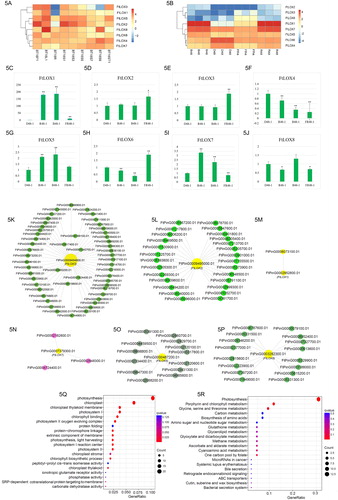
Figure 5. Expression profiles and enrichment analysis of FtLOX genes. The scale bar represents log2 FPKM values. (A) Heatmap of LOX gene expression in various buckwheat tissues. BT18F1: flower; BT18L1: leaf; BT18R: root; BT18ST1: stem; BT18S1: seed at the cell division stage; BT18S3: seed at the cell enlargement stage; BT18S5: seed at the reserve deposition stage; BT18S7: seed at the maturation stage; BT18S9: seed at the desiccation stage. (B) Heatmap of FtLOX gene expression with various light treatments. B: blue; D: dark; FR: far red; R: red. (C–J) qRT-PCR analysis of LOX gene expression in Tartary buckwheat exposed to different light wavelengths. Vertical bars indicate standard deviation. Asterisks indicate significantly up- or downregulated genes compared with their expression in the untreated control (*p < 0.05, **p < 0.01; Student’s t-test). (K–P) Co-expression network of FtLOX genes, obtained using Cytoscape v3.7.0. (Q) GO enrichment analysis of co-expressed genes. (R) KEGG enrichment analysis of co-expressed genes.