Figures & data
Table 1. Primers used to detect expression levels of pear invertase genes.
Figure 1. Phylogenetic tree of invertase genes in pear.
Note: All genes grouped into two different groups: acid invertases and neutral/alkaline invertases. The former were separated into CWIN and VIN clades, whereas the latter was grouped into α and β clades.
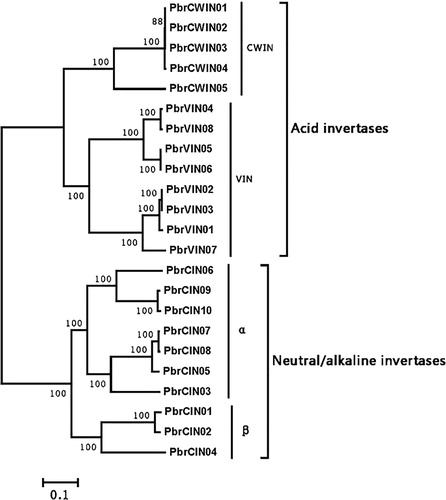
Table 2. The invertase genes in pear.
Figure 2. Chromosomal map and duplication events of paralogous invertase gene candidates in pear.
Note: The identity of each linkage group is indicated at the top of each bar. Only the chromosomes where invertase genes were mapped are shown. Possible segment and tandem duplicated genes are connected by color lines and boxes, respectively.
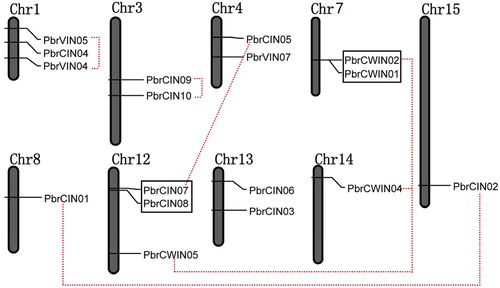
Figure 3. Motifs identified by MEME tools in pear invertases.
Note: Ten motifs (1 to 10) were identified and indicated by different colors.
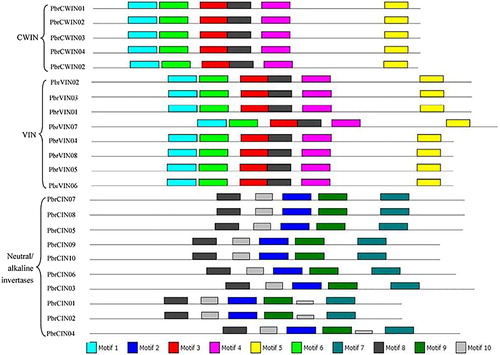
Table 3. Analysis of conserved motifs of invertase genes in pear.
Figure 4. Phylogenetic trees of pear, Arabidopsis and rice invertases.
Note: The full-length sequences of all invertase genes were aligned using ClustalX, and the phylogenetic tree was generated using MEGA 5.0 with the NJ method (1000 bootstrap replicates).
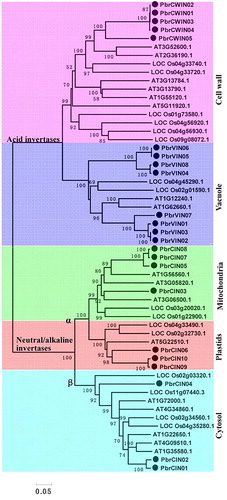
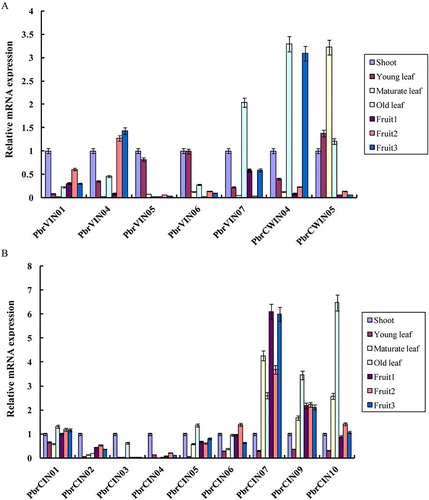
Figure 5. Relative expression levels of invertase genes in different tissues and the stage of fruit development. Expression patterns of acid invertases (a) and neutral/alkaline invertases (b).
Note: qRT-PCR analysis was performed to measure the expression levels. The x-axis represents the different tissues and the stage of fruit development and the y-axis represents the relative expression levels of the genes, shown as mean values ± SD from three replications. Pyrus EF1a (accession No. AY338250) was used as internal reference.