Figures & data
Figure 1. Schematic representation of overlapping histograms of positive control for proliferation (PC-3 cells cultured alone), negative control (Mitomycin C-treated PC-3 cells) and MSCs-co-cultured PC-3 cells and formula used to calculate the proliferation.
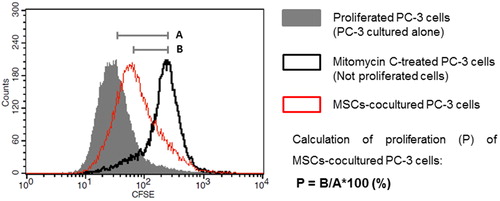
Figure 2. A graph of the proliferation of PC-3 cells cultured with MSCs (A) and MSCs-CM (B). Proliferation was measured by CFSE dilution via flow cytometry and calculated as a percentage of the proliferation of control cells cultured alone (100%). Culture duration: 5 days (■); 9 days (●). Statistically significant differences, unpaired t-test (*p < 0.05, **p < 0.01, ***p < 0.001, ****p < 0.0001).
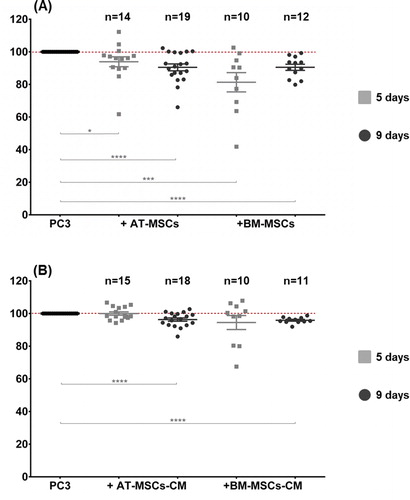
Figure 3. MSCs induce significant suppression of PC-3 viability. PC-3 cells were cultured on a monolayer of AT-MSCs (A) and BM-MSCs (B) for 9 days. Cell viability was measured by MTT test every 48 h from day 1 to day 9. Statistically significant differences, two-way ANOVA test (p < 0.0001).
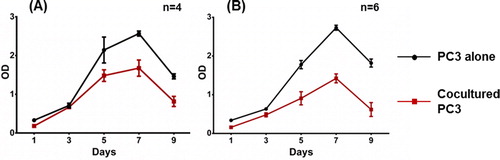
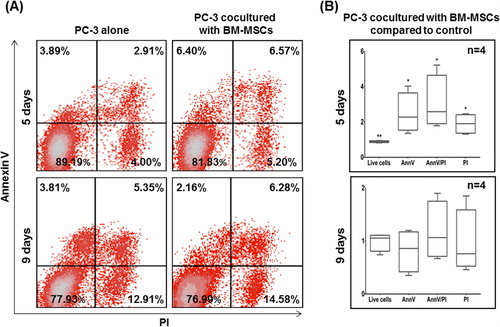
Figure 4a. (A) Representative flow cytometry dot plots for AnnV and PI of PC-3 cells co-cultured with AT-MSCs. (B) Living (AnnV-/PI-), early apoptotic (AnnV+/PI-), late apoptotic (AnnV+/PI+) and necrotic cells (AnnV-/PI+) are presented in the fold change versus control cells.
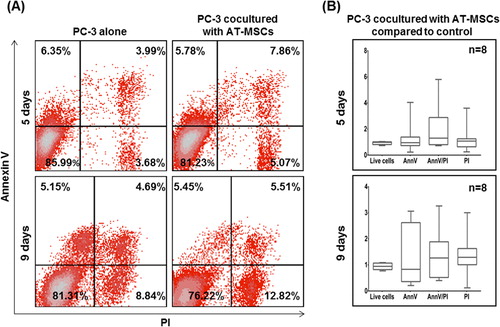
Figure 4b. (A) Representative flow cytometry dot plots for AnnV and PI of PC-3 cells co-cultured with BM-MSCs. (B) Living (AnnV-/PI-), early apoptotic (AnnV+/PI-), late apoptotic (AnnV+/PI+) and necrotic cells (AnnV-/PI+) are presented in the fold change versus control cells. Statistically significant differences, unpaired t-test (*p <0.05, **p < 0.01).