Figures & data
Table 1. QTL for plant height at pod bearing stage.
Table 2. QTL for plant height at seed filling period.
Table 3. QTL for plant height at maturity period.
Figure 1. Temporal contribution of QTL.
Temporal development of PVE or R2 of the QTL detected at PBS, SFS and MS for PH under low seeding density (Left) and high density (Right)
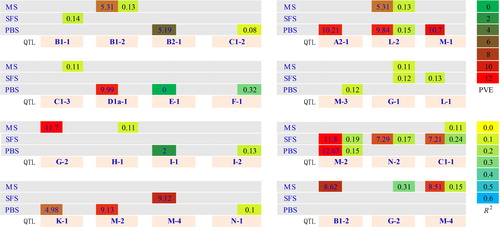
Figure 2. Venn diagram for QTL related to PH detected under two densities at three developmental stages.
PBS: Pod bearing stage; SFS: Seeds filling stage; MS: Maturity stage
D1: Planting density of 2.2 × 10⁵ plants/hm2 in Harbin OR 2.6 × 10⁵ plants/hm2 in Keshan; KD2 means planting density of 3.1 × 10⁵ plants/hm2 in Harbin OR 3.5 × 10⁵ plants/hm2 in Keshan
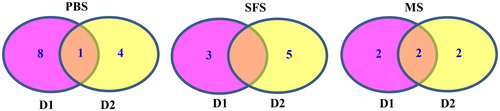
Figure 3. Additive effects of QTL for PH and AED detected in two populations under two kinds of densities over two location.
In the name of QTL, 36- or 60- represent QTL detected in RIL3613 or RIL6013 population; D1 or D2 indicate QTL detected under the first or second kind of density; qph and qphae represent QTL of PH and AED; B1, I, …, represent linkage groups; the number, i.e., 1,2, 3,4 represent the sequence of QTL in one linkage group.
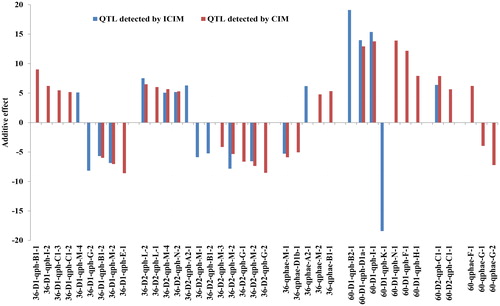
Figure 4. Additive effects of allelic combination of QTL qph-C1-3, qph-B1-2, qph-G-2 associated with PH at maturity stages.
Q1 and q1 represent allele of qph-C1-3 carried by Dongnong L13 and Heihe36, Q2 and q2 represent allele of qph- B1-2 carried by Dongnong L13 and Heihe36, Q3 and q3 represent allele of qph- G -2 carried by Dongnong L13 and Heihe36.
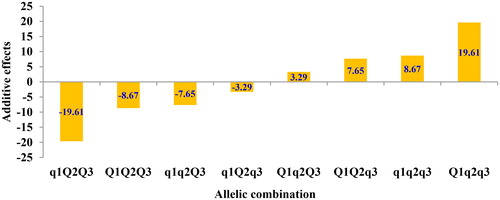
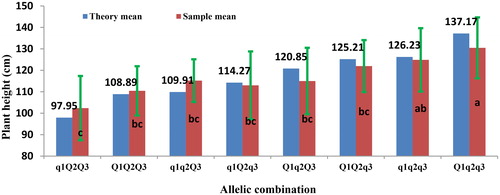
Figure 5. Theory and sample means of allelic combination of QTL qph-C1-3, qph-B1-2, qph-G-2 associated with PH at maturity stages.
Q1 and q1 represent allele of qph-C1-3 carried by Dongnong L13 and Heihe36, Q2 and q2 represent allele of qph-B1-2 carried by Dongnong L13 and Heihe36, Q3 and q3 represent allele of qph-G-2 carried by Dongnong L13 and Heihe36.
a, b, c indicate the significance of difference between the phenotype means of allelic combination, i.e., no same letter means difference between two allelic combination was significant at 0.05 level, the reverse is also true.