Figures & data
Table 1. Primers for Hum P, Bact16S, Aa, Pg, Pi, Td and Tf.
Figure 1. Relative expression of Pg (A), Td (B), Tf (C), Pi (D), Aa (E) and total bacteria (F) in the periodontium of patients.
Note: Data are the mean ± SEM (healthy controls, n = 426; moderate periodontitis, n = 602; severe periodontitis, n = 36). **P < 0.01 vs. healthy controls, ##P < 0.01 vs. moderate-periodontitis group.
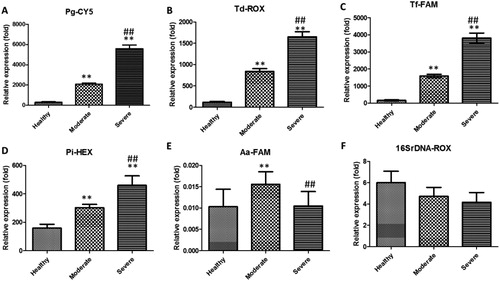
Figure 2. Correlation analyses among different periodontal pathogens (A–C) or between periodontal pathogens and probing depth (D–E). n = 1164, **p < 0.01.
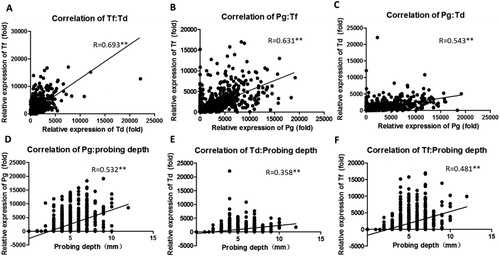
Table 2. Correlation coefficient for different periodontal pathogens or probing depth.
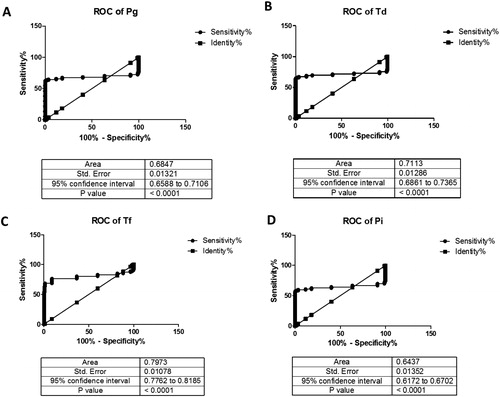
Figure 3. ROC curves were constructed to evaluate the diagnostic potential of periodontal pathogens for periodontitis (A–D).