
Figures & data
Figure 1. One target cell per image (a) and multiple target cells per image (b).
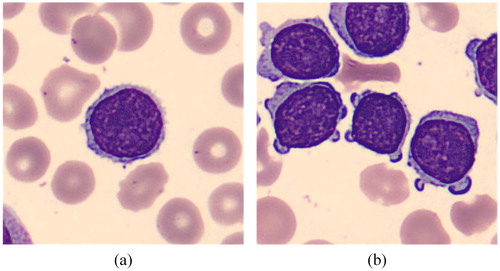
Figure 2. Lymphoma (a), blast (b), lymphocyte (c) and other cell (d).
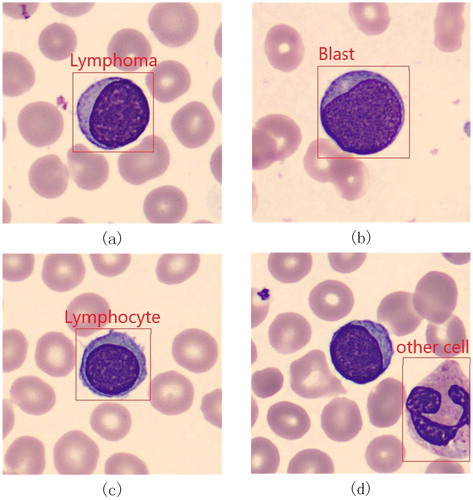
Table 1. Total number of cells of each class in the dataset.
Figure 3. Architecture of Faster R-CNN.
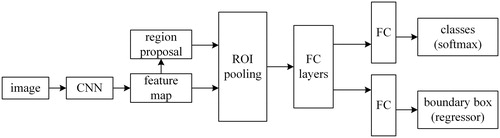
Table 2. Number of images of each part.
Table 3. mAP of 6 combinations of different methods and networks.
Figure 4. Loss for ZF (red), VGG16 (green), and VGG_CNN_M_1024 (blue).
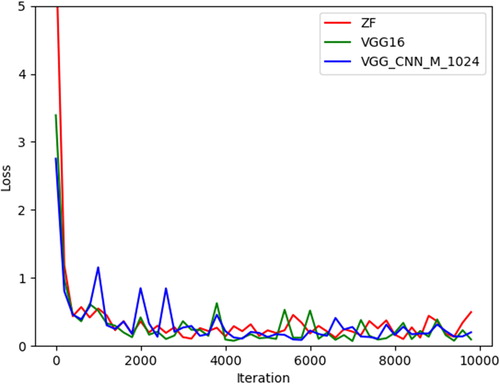
Table 4. Confusion matrix of the final model.
Table 5. Confusion matrix of KNN.
Table 6. Confusion matrix of VGG16.
Data availability statement
Raw data were generated at East China Normal University. Derived data supporting the findings of this study are available from the corresponding author Qingli Li on request. More details can be found from http://bio-hsi.ecnu.edu.cn