Figures & data
Table 1. Putative BOR1 homologs in 18 different plant species and their gene/protein features.
Table 2. Putative NIP5;1 homologs in 18 different plant species and their gene/protein features.
Table 3. Five most conserved motifs in BOR1 and NIP5;1 homologs in 18 different plant species.
Figure 1. Phylogenetic distribution of known BOR transporter and boric acid channel proteins in Arabidopsis thaliana and Oryza sativa. Phylogeny was constructed by MEGA 6 using ML method for 1000 bootstraps. This tree is used as benchmark to determine the clustering pattern of studied sequences.
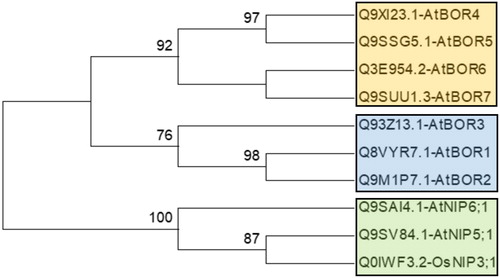
Figure 2. Phylogenetic distribution of BOR1 homologs in 18 different plants. Sequences were annotated along with respective homologs in Arabidopsis thaliana. Homology information is used as benchmark to determine the clustering pattern of the studied sequences. Circular phylogeny was constructed by MEGA 6 with ML method for 1000 bootstraps and visualized by FigTree. Blue, green and red segments respectively represent group A, B and C.
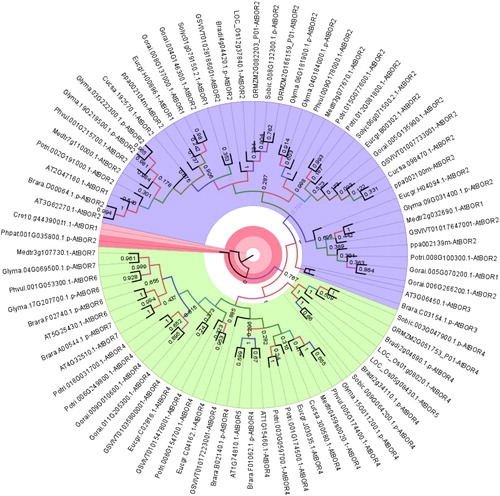
Figure 3. Phylogenetic distribution of NIP5;1 homologs in 18 different plants. Sequences were annotated along with respective homologs in Arabidopsis thaliana or Oryza sativa. Homology information is used as benchmark determine the clustering pattern of the studied sequences. Circular phylogeny was constructed by MEGA 6 with the ML method for 1000 bootstraps and visualized by FigTree. Blue, green and red segments respectively represent group A, B and C.
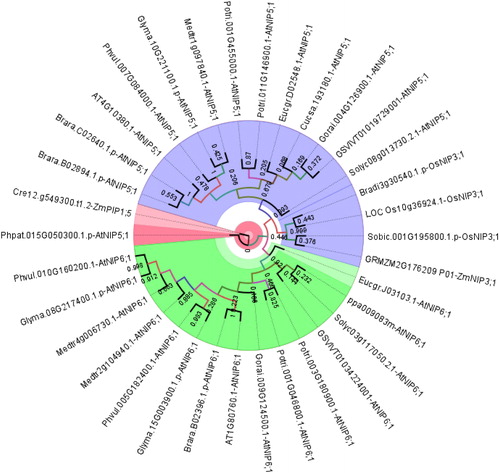
Figure 4. 3 D models of BOR1 transporters from Arabidopsis thaliana, Glycine max, Populus trichocarpa and Zea mays. TMDs were specified with different colors, TMD1 with red, TMD2 with blue, TMD3 with yellow, TMD4 with magenta, TMD5 with cyan, TMD6 with orange, TMD7 with green, TMD8 with wheat, TMD9 with pale green, TMD10 with pale yellow, and other structures with gray. Labeled residues show the potential motif signatures identified in alignment analysis.
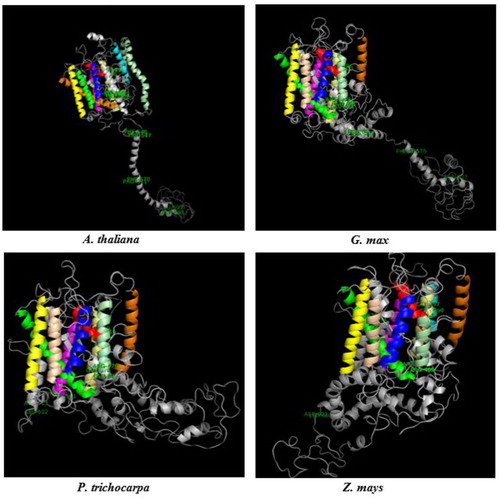
Figure 5. 3 D models of NIP5;1 boric acid channels from Arabidopsis thaliana, Glycine max, Populus trichocarpa and Zea mays. TMDs were specified with different colors, TMD1 with red, TMD2 with blue, TMD3 with yellow, TMD4 with magenta, TMD5 with cyan, TMD6 with orange and other structures with gray. Labeled residues show the potential motif signatures identified in alignment analysis.
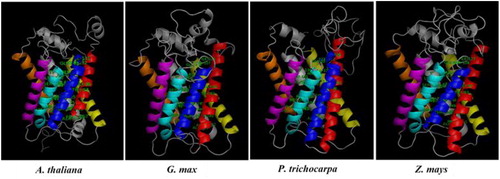
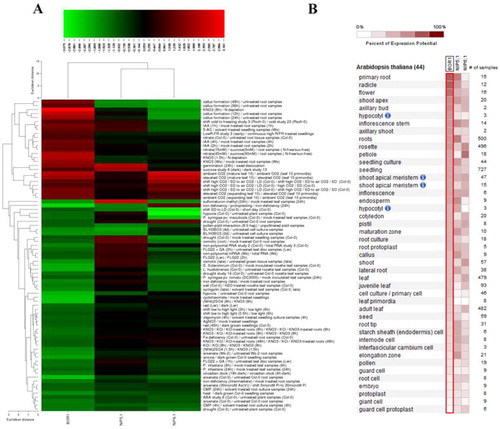
Figure 6. Gene expression profiles (A) and expressed anatomical parts (B) of Arabidopsis thaliana B transport genes BOR1, NIP5;1 and NIP6;1 under 78 different perturbations, including biotic, chemical, elicitor, hormone, light, nutrient, photoperiod and other stresses. In expression heatmap (A), conditions (left) and genes (top) with similar expression profiles were hierarchically clustered using Euclidean distance method. Green color indicates the downregulated genes and red color shows the upregulated genes. In anatomical part heatmap (B), blue circles with letter “i” indicate the presence of multiple hierarchical categories for related anatomical parts. For example, seedling > hypocotyl or shoot > hypocotyl.