Figures & data
Figure 1. The scheme of the construction of plasmid pCB301-CMVFny209△2b-PvSR2 and pCB301-CMV Fny209△2b-MCS.
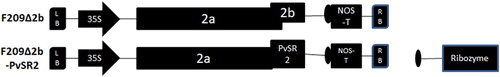
Figure 2. The results of the RT-PCR analysis of the attenuated CMV△2b virus and PvSR2 gene expression in the tested plants. Line 1, H2O; Line 2, Control; Line 3, CMV△2b; Line 4, Marker; Line 5, CMV△2b-PvSR2; Line 6, CMV△2b-bar.
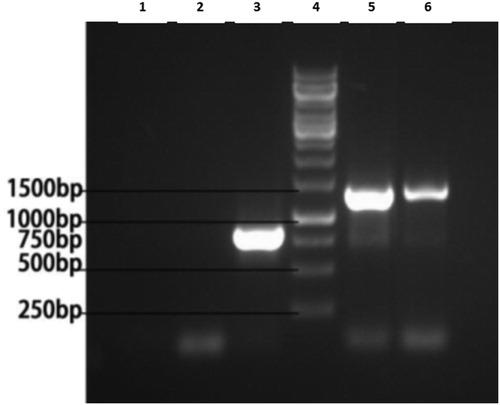
Figure 3. The Cd content in the treated plants. Treatment: Bar, CMV△2b-bar; PvSR2, CMV△2b-PvSR2; Control; CMV△2b. The Duncan’s method was used to test for significance (p < 0.05), indicated by different lowercase letters.
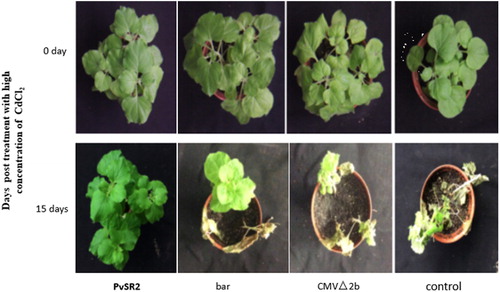
Figure 4. The growth of plant treated with high concentration of CdCl2. Treatment: Bar, CMV△2b-bar; PvSR2, CMV△2b-PvSR2; Control; CMV△2b.